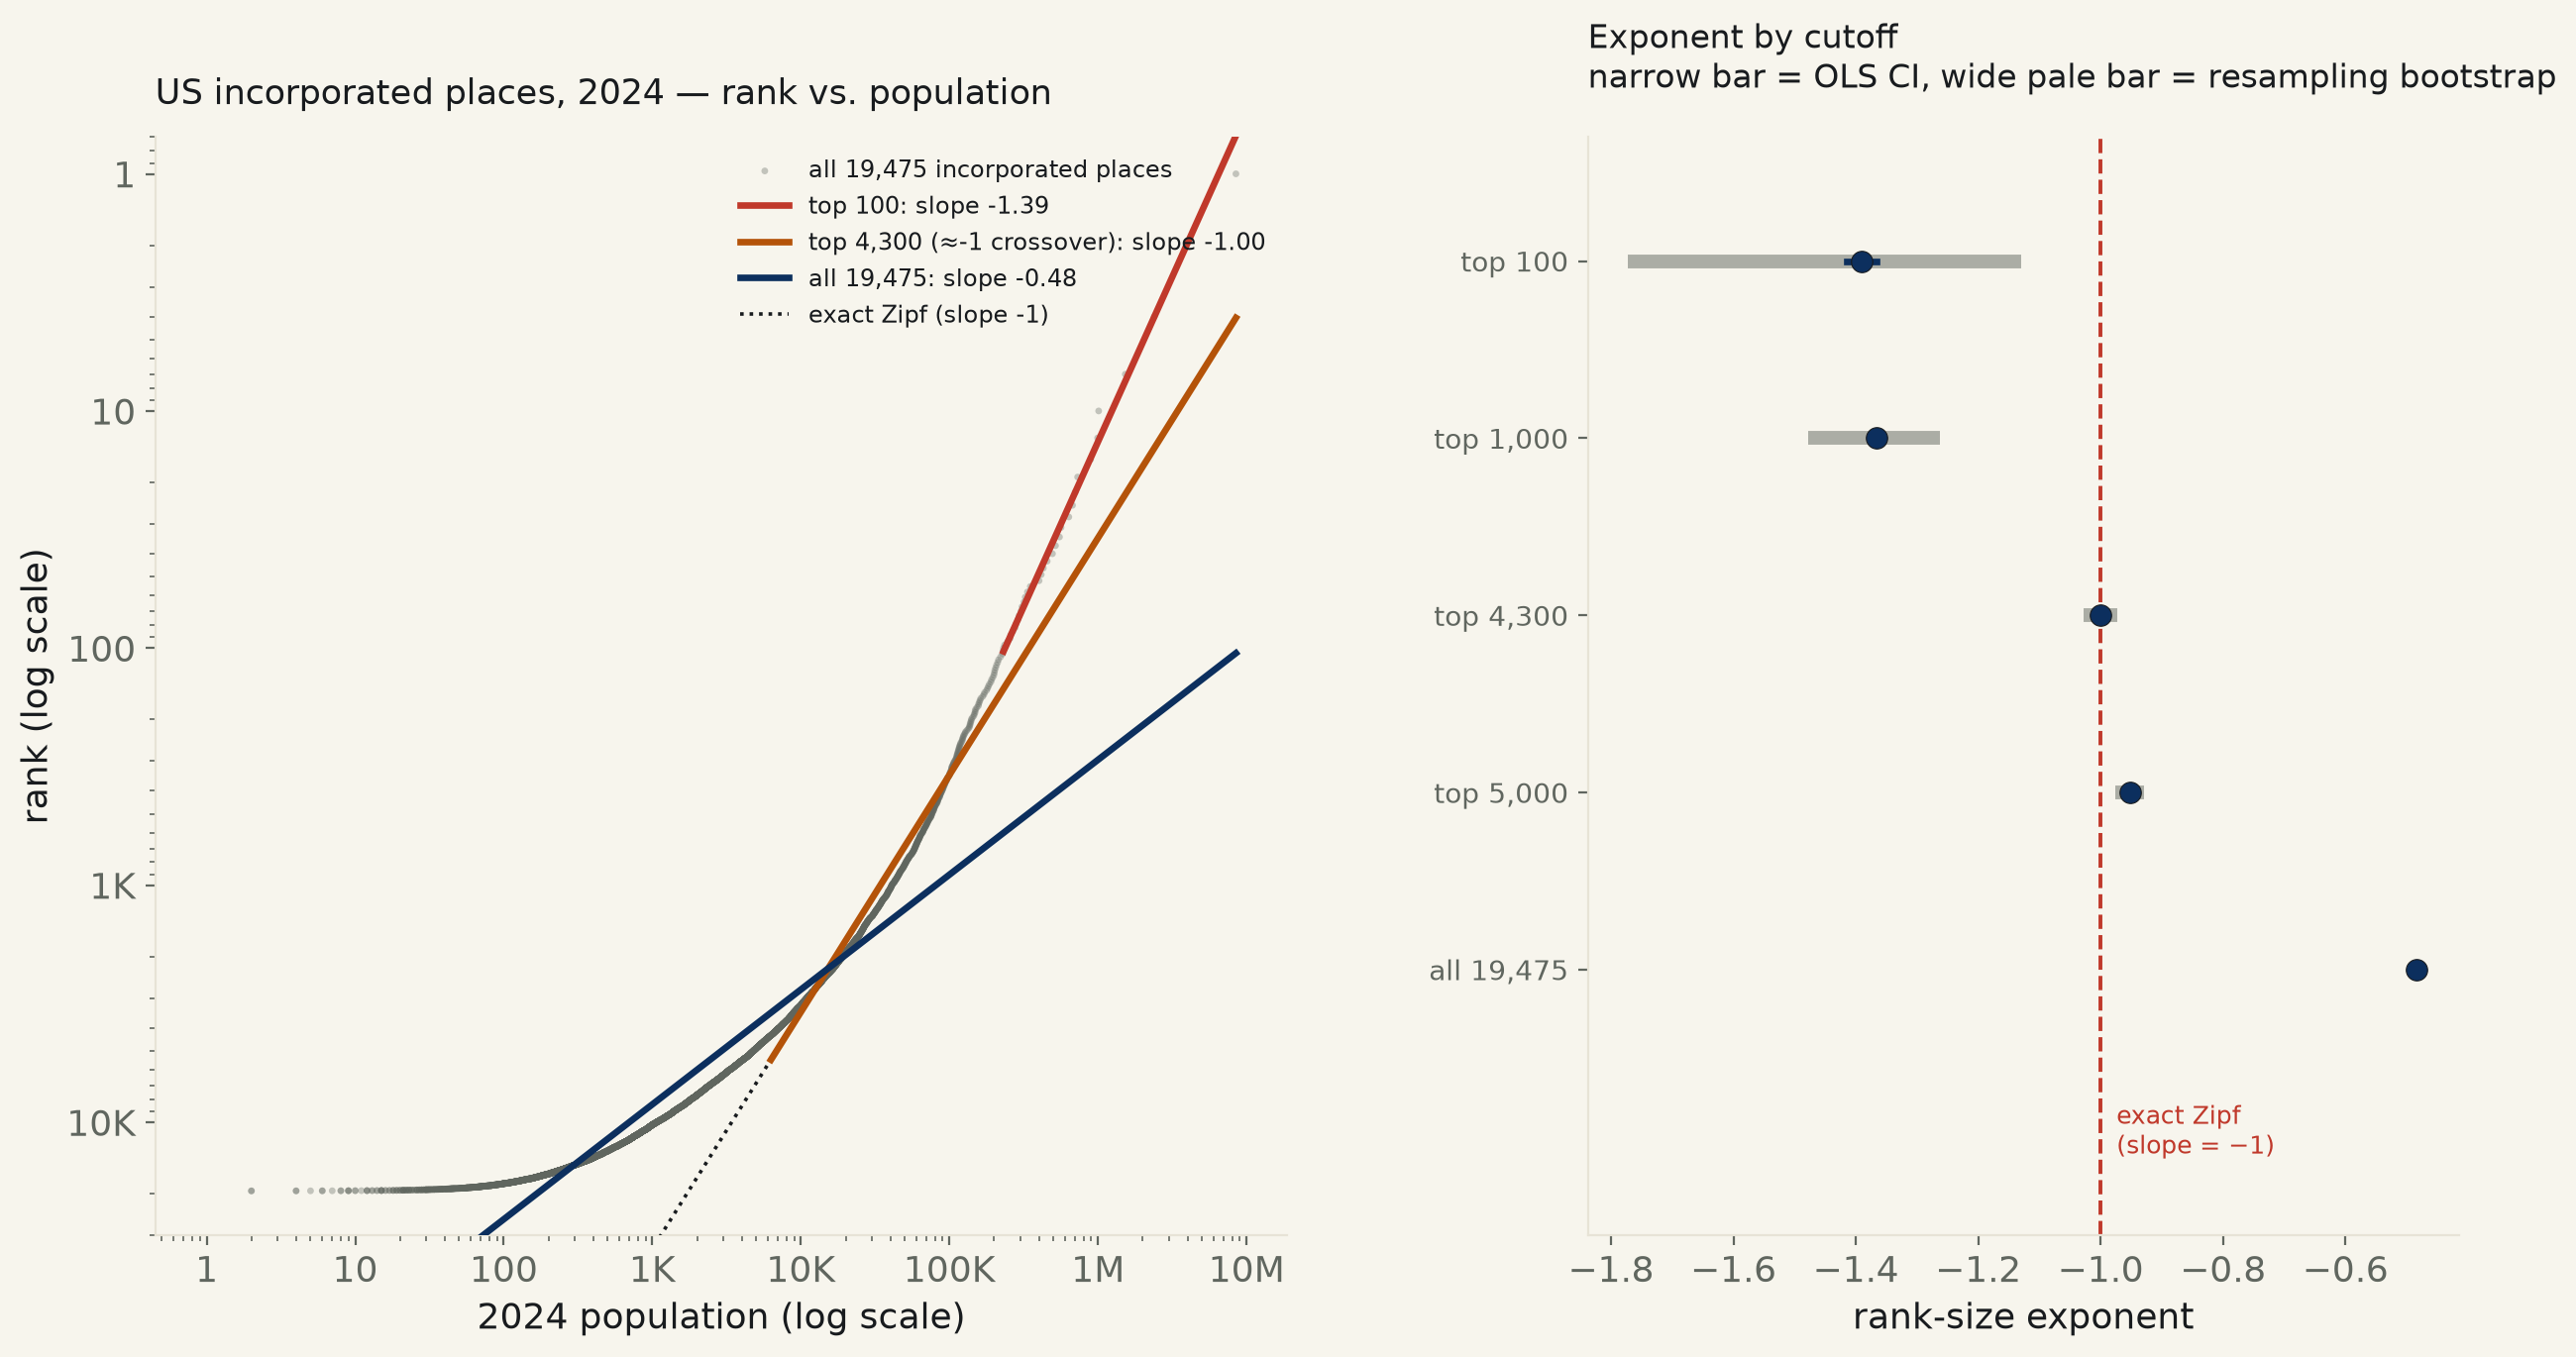
All 19,475 populated, legally incorporated US places (2024 Census PEP). The rank-size exponent is -1.39 for the 100 biggest cities (95% CI [-1.41, -1.37], bootstrap [-1.77, -1.13]) — steeper than Zipf’s textbook −1 — and flattens smoothly to -0.48 (CI [-0.4871, -0.4818]) across the full list. It crosses exactly −1 only in a narrow band near the 4,300th-largest place — not a stable regime, a single point on a moving curve.
The claim, stated as a near-law in urban economics since Zipf (1949) and reconfirmed for the US by Gabaix (1999): a country’s city sizes follow a rank-size rule — the Nth-largest city has roughly 1/N the population of the largest. Regress log(rank) on log(population) and the slope should land close to −1. Tested here against every one of the 19,479 populated, legally incorporated US places the Census Bureau’s 2024 Population Estimates Program tracks — cities, towns, villages and boroughs, reconstructed from the Bureau’s own county-part rows so that places split across county lines (New York city is five rows; Chicago and Houston are two and four) are summed to a single whole-place total, not silently dropped. 4 places with a 2024 estimate of exactly zero — incorporated municipalities with no counted residents — are excluded from the log-log fit and listed on the page, not folded in as a guess. 19,475 places remain.
The exponent is not one number — it moves, smoothly and by a lot, depending how far down the list you fit. Restricted to the 100 biggest cities, the slope is -1.39, 95% CI [-1.41, -1.37] — visibly steeper than Zipf’s −1, and because rank within one fixed sample is a deterministic function of population (not iid noise around it), the plain-OLS interval understates the real uncertainty. A case-resampling bootstrap that redraws the full 19,475-place national list with replacement and refits at each cutoff gives a properly wide interval instead — [-1.77, -1.13] for the top 100 — and it still excludes −1. The top 1,000 tells the same story, tighter: -1.37, bootstrap CI [-1.48, -1.26]. America’s biggest cities are more concentrated at the very top than the textbook rule predicts.
The exponent only touches −1 in one narrow band, not a stable regime. Widening the cutoff to the top 4,300 places (population ≥ 6,286, Horace city, North Dakota, sits right at the boundary) lands the slope at -0.9997, 95% CI [-1.0050, -0.9945] — the one cutoff on this ladder whose interval contains −1, and the bootstrap agrees, [-1.0279, -0.9731]. It does not hold as a plateau: one step wider, at the top 5,000, the slope has already drifted to -0.9519 and the interval no longer reaches −1. Zipf’s exact exponent is a crossing point on a moving curve here, not a regime the data settles into.
Across the full national list the slope keeps flattening, to -0.48 (95% CI [-0.4871, -0.4818], bootstrap [-0.4893, -0.4795]) — roughly half the textbook value, and R²=0.870 even here, so the flattening is not the fit degrading, it is the exponent itself changing. The pull comes from sheer count: thousands of incorporated towns with a few hundred residents or fewer, down to Warm River city, Idaho (population 1) and Monowi village, Nebraska (population 2), sit at the bottom of a national list the same way NYC sits at the top — and there are vastly more of them than a single power law fit to the big end would predict.
| Cutoff | n | exponent | 95% CI (OLS) | 95% CI (bootstrap) | R² | CI contains −1? |
|---|---|---|---|---|---|---|
| top 100 | 100 | -1.3904 | [-1.4148, -1.3660] | [-1.7732, -1.1293] | 0.992 | no |
| top 1,000 | 1,000 | -1.3661 | [-1.3702, -1.3620] | [-1.4779, -1.2631] | 0.998 | no |
| top 4,300 (crossover) | 4,300 | -0.9997 | [-1.0050, -0.9945] | [-1.0279, -0.9731] | 0.970 | yes |
| top 5,000 | 5,000 | -0.9519 | [-0.9569, -0.9469] | [-0.9756, -0.9294] | 0.966 | no |
| all 19,475 | 19,475 | -0.4844 | [-0.4871, -0.4818] | [-0.4893, -0.4795] | 0.870 | no |
Bootstrap: 4,000-draw case resampling, redrawing the full 19,475-place national list with replacement and refitting at each cutoff — wider than the plain-OLS interval at every cutoff, most visibly at n=100, because rank inside one fixed sample is a deterministic function of population, not independent noise around it. Gabaix-Ibragimov (2011) rank−1/2 correction (not tabled) moves each point estimate by at most 0.02 and changes no −1 verdict.
Method. Source: US Census Bureau, Population Estimates Program, vintage 2024 sub-county totals file (SUB-EST2024, released 2025-05-15), the Bureau's own row-level CSV, no key required. Rows at SUMLEV=157 ("place, county part") are summed by state+place FIPS code to reconstruct each place's whole population, since the Bureau does not print a single whole-place row for places that straddle a county line; PLACE code 99990 ("balance of county," an unincorporated residual, not a place) is dropped before summing, and every code is verified to map to exactly one place name before the sum runs. Rank-size regressions are plain OLS, log(rank) on log(population), at cutoffs from the 100 largest places to all 19,475; a 4,000-draw case-resampling bootstrap redraws the full national list to get an honest interval, since ranks computed within one fixed sample understate sampling uncertainty on their own.
Limits, stated plainly. This tests legally incorporated place boundaries — city limits, an artifact of annexation history and state incorporation law — not metropolitan statistical areas or urban agglomerations. Gabaix's own 1999 result, and most of the literature finding an exponent close to −1, fits city-size distributions defined by urbanized-area or metro-area boundaries, a different and more economically meaningful geography that this run does not have on hand. A city like Los Angeles, whose metro area sprawls across dozens of separately incorporated suburbs, is one row here at its city-limit population only; that fragmentation is a plausible mechanical driver of both the steep top-end exponent and the shallow full-list one, not tested directly in this run. n at the low-population end includes place types (boroughs, unincorporated-in-spirit "cities" of a handful of residents) whose legal status varies by state and is taken from the Bureau's own classification, not re-adjudicated here.
| Rank | Place | State | 2024 population |
|---|---|---|---|
| 1 | New York city | New York | 8,478,072 |
| 2 | Los Angeles city | California | 3,878,704 |
| 3 | Chicago city | Illinois | 2,721,308 |
| 4 | Houston city | Texas | 2,390,125 |
| 5 | Phoenix city | Arizona | 1,673,164 |
| 6 | Philadelphia city | Pennsylvania | 1,573,916 |
| 7 | San Antonio city | Texas | 1,526,656 |
| 8 | San Diego city | California | 1,404,452 |
| 9 | Dallas city | Texas | 1,326,087 |
| 10 | Jacksonville city | Florida | 1,009,833 |
| 11 | Fort Worth city | Texas | 1,008,106 |
| 12 | San Jose city | California | 997,368 |
| 13 | Austin city | Texas | 993,588 |
| 14 | Charlotte city | North Carolina | 943,476 |
| 15 | Columbus city | Ohio | 933,263 |
| 16 | Indianapolis city (balance) | Indiana | 891,484 |
| 17 | San Francisco city | California | 827,526 |
| 18 | Seattle city | Washington | 780,995 |
| 19 | Denver city | Colorado | 729,019 |
| 20 | Oklahoma City city | Oklahoma | 712,919 |
| 21 | Nashville-Davidson metropolitan government (balance) | Tennessee | 704,963 |
| 22 | Washington city | District of Columbia | 702,250 |
| 23 | El Paso city | Texas | 681,723 |
| 24 | Las Vegas city | Nevada | 678,922 |
| 25 | Boston city | Massachusetts | 673,458 |
| 26 | Detroit city | Michigan | 645,705 |
| 27 | Louisville/Jefferson County metro government (balance) | Kentucky | 640,796 |
| 28 | Portland city | Oregon | 635,749 |
| 29 | Memphis city | Tennessee | 610,919 |
| 30 | Baltimore city | Maryland | 568,271 |
| 31 | Milwaukee city | Wisconsin | 563,531 |
| 32 | Albuquerque city | New Mexico | 560,326 |
| 33 | Tucson city | Arizona | 554,013 |
| 34 | Fresno city | California | 550,105 |
| 35 | Sacramento city | California | 535,798 |
| 36 | Atlanta city | Georgia | 520,070 |
| 37 | Mesa city | Arizona | 517,151 |
| 38 | Kansas City city | Missouri | 516,032 |
| 39 | Raleigh city | North Carolina | 499,825 |
| 40 | Colorado Springs city | Colorado | 493,554 |
| 41 | Omaha city | Nebraska | 489,265 |
| 42 | Miami city | Florida | 487,014 |
| 43 | Virginia Beach city | Virginia | 454,808 |
| 44 | Long Beach city | California | 450,901 |
| 45 | Oakland city | California | 443,554 |
| 46 | Minneapolis city | Minnesota | 428,579 |
| 47 | Bakersfield city | California | 417,468 |
| 48 | Tulsa city | Oklahoma | 415,154 |
| 49 | Tampa city | Florida | 414,547 |
| 50 | Arlington city | Texas | 403,672 |
| 51 | Aurora city | Colorado | 403,130 |
| 52 | Wichita city | Kansas | 400,991 |
| 53 | Cleveland city | Ohio | 365,379 |
| 54 | New Orleans city | Louisiana | 362,701 |
| 55 | Henderson city | Nevada | 350,039 |
| 56 | Urban Honolulu CDP | Hawaii | 344,967 |
| 57 | Anaheim city | California | 344,561 |
| 58 | Orlando city | Florida | 334,854 |
| 59 | Lexington-Fayette urban county | Kentucky | 329,437 |
| 60 | Stockton city | California | 324,975 |
| 61 | Riverside city | California | 323,757 |
| 62 | Irvine city | California | 318,683 |
| 63 | Corpus Christi city | Texas | 317,317 |
| 64 | Newark city | New Jersey | 317,303 |
| 65 | Santa Ana city | California | 316,184 |
| 66 | Cincinnati city | Ohio | 314,915 |
| 67 | Pittsburgh city | Pennsylvania | 307,668 |
| 68 | St. Paul city | Minnesota | 307,465 |
| 69 | Greensboro city | North Carolina | 307,381 |
| 70 | Jersey City city | New Jersey | 302,824 |
| 71 | Durham city | North Carolina | 301,870 |
| 72 | Lincoln city | Nebraska | 300,619 |
| 73 | North Las Vegas city | Nevada | 294,034 |
| 74 | Plano city | Texas | 293,286 |
| 75 | Anchorage municipality | Alaska | 289,600 |
| 76 | Gilbert town | Arizona | 288,790 |
| 77 | Madison city | Wisconsin | 285,300 |
| 78 | Reno city | Nevada | 281,714 |
| 79 | Chandler city | Arizona | 281,231 |
| 80 | St. Louis city | Missouri | 279,695 |
| 81 | Chula Vista city | California | 278,546 |
| 82 | Buffalo city | New York | 276,617 |
| 83 | Fort Wayne city | Indiana | 273,203 |
| 84 | Lubbock city | Texas | 272,086 |
| 85 | St. Petersburg city | Florida | 267,102 |
| 86 | Toledo city | Ohio | 265,638 |
| 87 | Laredo city | Texas | 261,260 |
| 88 | Port St. Lucie city | Florida | 258,575 |
| 89 | Glendale city | Arizona | 258,143 |
| 90 | Irving city | Texas | 258,060 |
| 91 | Winston-Salem city | North Carolina | 255,769 |
| 92 | Chesapeake city | Virginia | 254,997 |
| 93 | Garland city | Texas | 250,431 |
| 94 | Scottsdale city | Arizona | 246,170 |
| 95 | Boise City city | Idaho | 237,963 |
| 96 | Hialeah city | Florida | 235,388 |
| 97 | Frisco city | Texas | 235,208 |
| 98 | Richmond city | Virginia | 233,655 |
| 99 | Cape Coral city | Florida | 233,025 |
| 100 | Norfolk city | Virginia | 231,105 |
| 101 | Spokane city | Washington | 230,609 |
| 102 | Huntsville city | Alabama | 230,402 |
| 103 | Santa Clarita city | California | 229,159 |
| 104 | Tacoma city | Washington | 228,202 |
| 105 | Fremont city | California | 228,192 |
| 106 | McKinney city | Texas | 227,526 |
| 107 | San Bernardino city | California | 224,775 |
| 108 | Baton Rouge city | Louisiana | 220,907 |
| 109 | Modesto city | California | 220,592 |
| 110 | Fontana city | California | 218,455 |
| 111 | Salt Lake City city | Utah | 217,783 |
| 112 | Moreno Valley city | California | 213,919 |
| 113 | Des Moines city | Iowa | 213,096 |
| 114 | Worcester city | Massachusetts | 211,286 |
| 115 | Yonkers city | New York | 211,040 |
| 116 | Fayetteville city | North Carolina | 209,496 |
| 117 | Sioux Falls city | South Dakota | 209,289 |
| 118 | Grand Prairie city | Texas | 207,331 |
| 119 | Rochester city | New York | 207,282 |
| 120 | Tallahassee city | Florida | 205,089 |
| 121 | Little Rock city | Arkansas | 204,774 |
| 122 | Amarillo city | Texas | 203,729 |
| 123 | Overland Park city | Kansas | 202,893 |
| 124 | Columbus city | Georgia | 201,830 |
| 125 | Augusta-Richmond County consolidated government (balance) | Georgia | 201,737 |
| 126 | Mobile city | Alabama | 201,367 |
| 127 | Oxnard city | California | 200,616 |
| 128 | Grand Rapids city | Michigan | 200,117 |
| 129 | Peoria city | Arizona | 199,924 |
| 130 | Vancouver city | Washington | 198,992 |
| 131 | Knoxville city | Tennessee | 198,722 |
| 132 | Birmingham city | Alabama | 196,357 |
| 133 | Montgomery city | Alabama | 195,818 |
| 134 | Providence city | Rhode Island | 194,706 |
| 135 | Huntington Beach city | California | 193,151 |
| 136 | Brownsville city | Texas | 191,967 |
| 137 | Chattanooga city | Tennessee | 191,496 |
| 138 | Fort Lauderdale city | Florida | 190,641 |
| 139 | Tempe city | Arizona | 190,114 |
| 140 | Akron city | Ohio | 189,664 |
| 141 | Glendale city | California | 187,823 |
| 142 | Clarksville city | Tennessee | 185,690 |
| 143 | Ontario city | California | 185,285 |
| 144 | Newport News city | Virginia | 183,056 |
| 145 | Elk Grove city | California | 182,797 |
| 146 | Cary town | North Carolina | 182,659 |
| 147 | Aurora city | Illinois | 180,710 |
| 148 | Salem city | Oregon | 180,406 |
| 149 | Pembroke Pines city | Florida | 179,326 |
| 150 | Eugene city | Oregon | 178,786 |
| 151 | Santa Rosa city | California | 177,524 |
| 152 | Rancho Cucamonga city | California | 176,675 |
| 153 | Shreveport city | Louisiana | 176,578 |
| 154 | Garden Grove city | California | 172,361 |
| 155 | Oceanside city | California | 170,941 |
| 156 | Fort Collins city | Colorado | 170,924 |
| 157 | Springfield city | Missouri | 170,596 |
| 158 | Murfreesboro city | Tennessee | 168,387 |
| 159 | Surprise city | Arizona | 167,564 |
| 160 | Lancaster city | California | 167,426 |
| 161 | Denton city | Texas | 165,998 |
| 162 | Roseville city | California | 163,304 |
| 163 | Palmdale city | California | 162,536 |
| 164 | Corona city | California | 161,540 |
| 165 | Salinas city | California | 160,783 |
| 166 | Killeen city | Texas | 160,616 |
| 167 | Paterson city | New Jersey | 160,463 |
| 168 | Alexandria city | Virginia | 159,102 |
| 169 | Hollywood city | Florida | 159,073 |
| 170 | Hayward city | California | 158,440 |
| 171 | Charleston city | South Carolina | 157,665 |
| 172 | Macon-Bibb County | Georgia | 157,056 |
| 173 | Lakewood city | Colorado | 156,868 |
| 174 | Sunnyvale city | California | 156,792 |
| 175 | Kansas City city | Kansas | 156,752 |
| 176 | Springfield city | Massachusetts | 154,888 |
| 177 | Bellevue city | Washington | 154,377 |
| 178 | Naperville city | Illinois | 153,124 |
| 179 | Joliet city | Illinois | 151,837 |
| 180 | Bridgeport city | Connecticut | 151,599 |
| 181 | Mesquite city | Texas | 150,140 |
| 182 | Pasadena city | Texas | 149,617 |
| 183 | Olathe city | Kansas | 149,035 |
| 184 | Escondido city | California | 148,847 |
| 185 | Savannah city | Georgia | 148,808 |
| 186 | McAllen city | Texas | 148,782 |
| 187 | Gainesville city | Florida | 148,720 |
| 188 | Pomona city | California | 147,966 |
| 189 | Rockford city | Illinois | 147,486 |
| 190 | Thornton city | Colorado | 146,689 |
| 191 | Waco city | Texas | 146,608 |
| 192 | Visalia city | California | 146,271 |
| 193 | Syracuse city | New York | 146,097 |
| 194 | Columbia city | South Carolina | 144,788 |
| 195 | Midland city | Texas | 143,687 |
| 196 | Miramar city | Florida | 143,242 |
| 197 | Palm Bay city | Florida | 142,023 |
| 198 | Jackson city | Mississippi | 141,449 |
| 199 | Coral Springs city | Florida | 140,808 |
| 200 | Victorville city | California | 140,721 |
us_places_2024_521.csv (all 19,475 places) · fit output (JSON).
