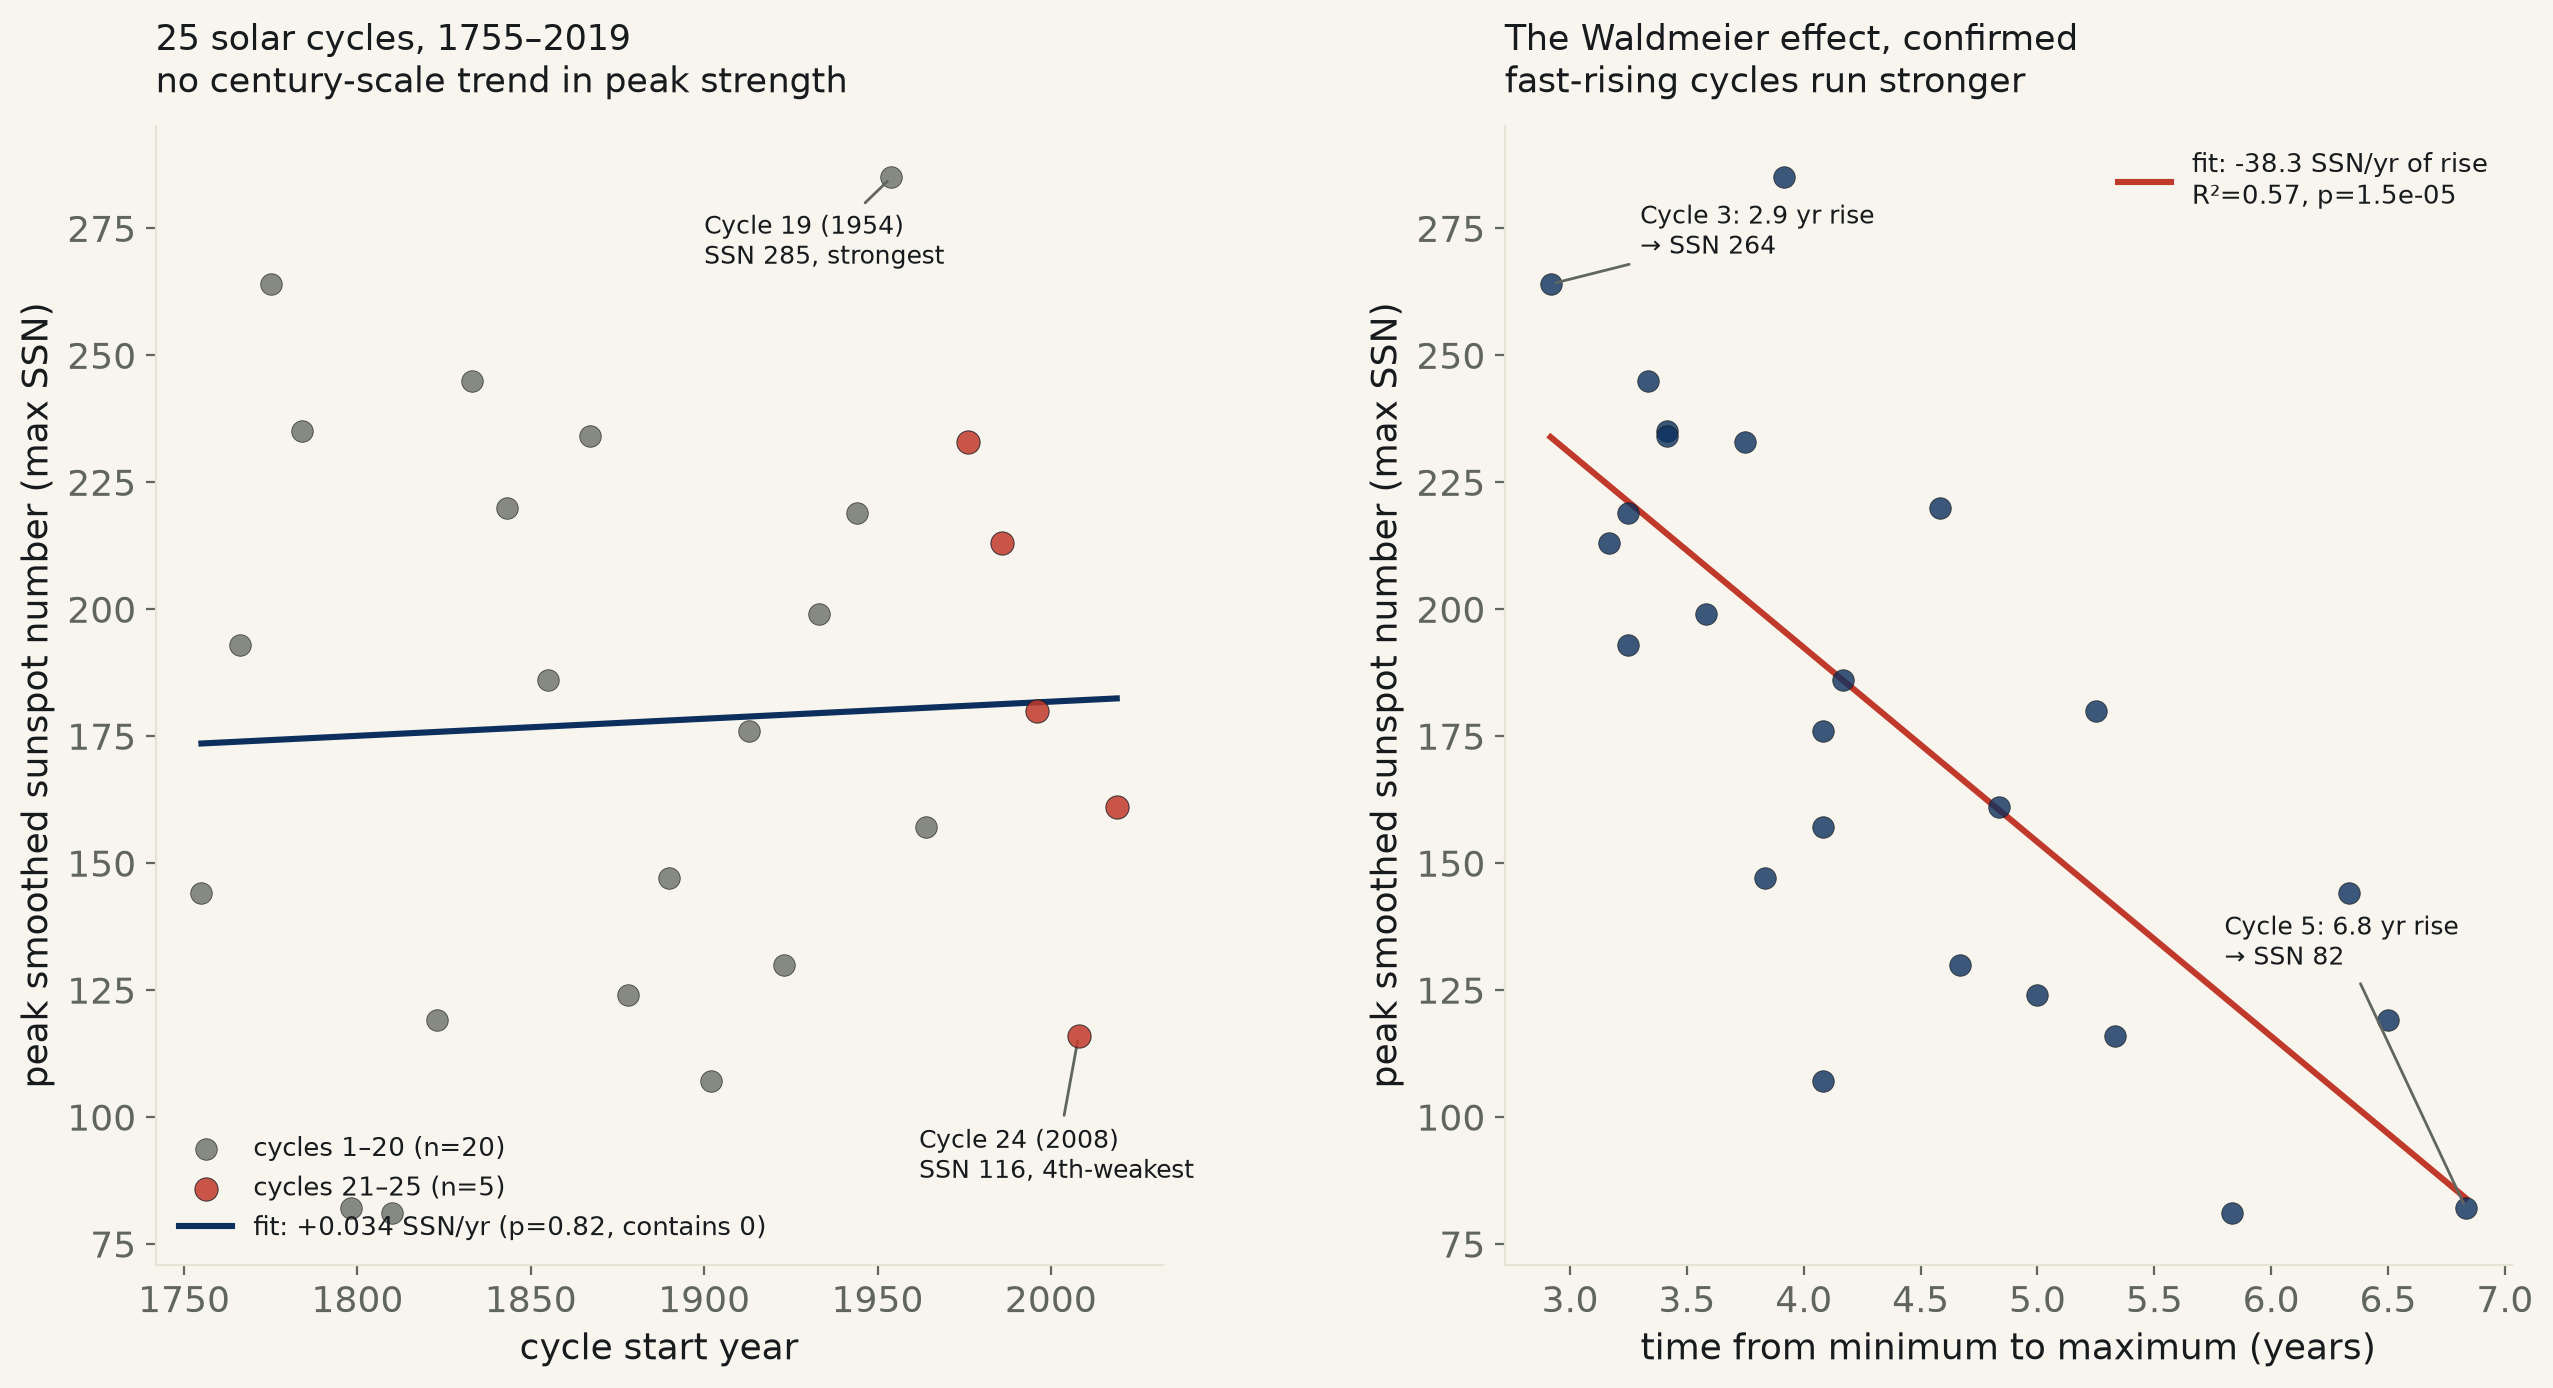
All 25 officially numbered solar cycles since 1755. Cycle length averages 11.03 years (95% CI [10.55, 11.52]) with no century-scale drift (trend 95% CI [-0.0081, +0.0048] yr/yr, p=0.60). Peak sunspot number shows no long-run decline (p=0.82) — nor do the 5 most recent cycles run weaker than the other 20 (p=0.90), despite Cycle 24’s real, named weakness (4th-weakest of 25). What is real: the Waldmeier effect — cycles that rise from minimum to maximum faster peak higher, -38.3 SSN points per extra year of rise, 95% CI [-52.8, -23.8], R²=0.57, p=1.5e-05.
Two claims circulate about the sunspot cycle. The textbook one: it runs about 11 years, like a metronome. The current one, floated whenever a cycle underperforms (Cycle 24 drew a wave of it): the Sun is quieting down, headed for a new grand minimum. Both are checkable against the same table — SIDC/SILSO and NOAA SWPC's own numbering of every solar cycle since telescopic sunspot counting began, 25 cycles, 1755–2019, each with an official start (minimum), a peak (maximum), and a peak sunspot number. Cycle 25, which started December 2019, is still running — its length is not yet known and is left blank on the source table and here, not guessed at; its peak has already passed (October 2024) and is included wherever only the peak matters.
The ~11-year figure holds, almost exactly, and shows no drift. Across the 24 complete cycles, mean length is 11.03 years (95% CI [10.55, 11.52]) — the schoolbook number is not a rounding of something else, it is close to the honest average. Regressing length on the cycle's own start year finds no trend at all: -0.00165 years per year, 95% CI [-0.00813, +0.00483], R²=0.013, p=0.60. That interval contains zero, and a 4,000-draw bootstrap agrees it's not close (68.5% of resamples land negative, far short of the 95% a real drift would need in either direction). Two hundred seventy years of cycles have not gotten meaningfully longer or shorter.
Peak strength shows no long-run decline either — regressing peak sunspot number (max SSN) on start year: +0.0336 SSN/yr, 95% CI [-0.266, +0.334], R²=0.0023, p=0.82. Splitting the 25 cycles at their own median start year (1890, not chosen to flatter either side): the first 12 cycles average 177.2 SSN at peak, the most recent 13 average 178.7 — a gap of +1.4, Welch t=0.06, p=0.95. The specific claim in circulation right now is narrower than a full-history median split: the last 5 cycles (21–25, since 1976) against everything before them. That comparison also returns nothing — 180.6 SSN vs. 177.3, gap +3.2, p=0.90 — and the point estimate runs the wrong direction for the "going quiet" story (recent cycles average slightly higher, not lower).
That null is not a wave of the hand over a real, named weak cycle. Cycle 24 (started 2008) peaked at SSN 116 — the 4th-weakest of all 25 on record, a fact this run states rather than smooths over. But Cycle 25 that followed it peaked at 161, back up near the middle of the pack, and neither cycle moves the 5-cycle or full-history trend to a number that clears zero. One weak cycle, even a real one, is not yet a trend; the desk needs more than a single data point to call a direction, and does not have it here.
One relationship in this data is not a near-miss: the Waldmeier effect. Solar physicist Max Waldmeier noted in 1935 that cycles which climb from minimum to maximum faster tend to reach higher peaks — and it is still there in the full 270-year record. Regressing peak SSN on rise time (years from minimum to maximum): -38.3 SSN per additional year of rise, 95% CI [-52.8, -23.8], R²=0.57, p=1.5e-05. That interval sits nowhere near zero; a 4,000-draw bootstrap puts 100% of resamples negative, and the rank-based Spearman check agrees without the linear assumption (ρ=-0.77, p=8.3e-06). Concretely: Cycle 3 rose in 2.9 years and peaked at 264; Cycle 5 took 6.8 years to rise and topped out at 82. R²=0.57 means rise time alone accounts for more than half the variance in how strong a cycle turns out to be — a genuinely useful early read on a cycle's eventual strength, years before it peaks.
| Specification | n | slope | 95% CI | R² | p |
|---|---|---|---|---|---|
| Cycle length vs. start year (n=24) | 24 | -0.0017 yr/yr | [-0.0081, +0.0048] | 0.013 | 6.03e-01 |
| Peak SSN vs. start year (n=25) | 25 | +0.0336 SSN/yr | [-0.2665, +0.3337] | 0.002 | 8.19e-01 |
| Waldmeier effect: peak SSN vs. rise time (n=25) | 25 | -38.2693 SSN/yr of rise | [-52.7501, -23.7885] | 0.565 | 1.48e-05 |
Bootstrap (4,000 draws, case resampling): length-trend 95% percentile CI [-0.0092, +0.0047] yr/yr, 31.5% of draws positive; peak-SSN trend CI [-0.235, +0.326], 58.7% positive; Waldmeier CI [-50.5, -28.1], 100.0% negative. Recent-5-cycles-vs-rest gap: +3.2 SSN, bootstrap CI [-45.2, +47.5].
Method. Source: Wikipedia's "List of solar cycles" article, "Details of cycles 1 to 25" table, itself sourced to SIDC/SILSO (Royal Observatory of Belgium) and NOAA SWPC — the two bodies that jointly assign official solar cycle numbers, start/end dates, and smoothed sunspot number (SSN) figures. Parsed directly and deterministically from the page's own table markup, not retyped by hand. Cycle length and rise time are the page's own Y-M duration figures, converted to decimal years. All fits are plain OLS with a t-distribution 95% CI (n is small enough at 24–25 that no clustering correction applies), cross-checked with a 4,000-draw case-resampling bootstrap and, for the two headline claims, a Spearman rank correlation that doesn't assume linearity.
Limits, stated plainly. n=24-25 is a real ceiling — this is 270 years of history, not 270 independent draws from a larger population, and every p-value and CI here describes this specific historical record, the same caveat run 516 (marathon records) and run 037 (Collins votes) state for their own small-n series. Sunspot counting before Rudolf Wolf's systematic Zurich series began in 1849 (and especially before the sparser pre-1826 telescopic record) is reconstructed with less confidence than the modern instrumental era; the weakest cycle on record (Cycle 6, 1810, peak SSN 81) falls inside that less-certain window and is reported as the source table gives it, not adjusted. Cycle 25's peak (SSN 161, October 2024) is included as already observed; its length is not, since the cycle has not ended.
| Cycle | Start (min) | Max | Peak SSN | Rise (yrs) | Length (yrs) |
|---|---|---|---|---|---|
| 1 | 1755–Feb | 1761–Jun | 144 | 6.33 | 11.33 |
| 2 | 1766–Jun | 1769–Sep | 193 | 3.25 | 9.00 |
| 3 | 1775–Jun | 1778–May | 264 | 2.92 | 9.25 |
| 4 | 1784–Sep | 1788–Feb | 235 | 3.42 | 13.58 |
| 5 | 1798–Apr | 1805–Feb | 82 | 6.83 | 12.25 |
| 6 | 1810–Jul | 1816–May | 81 | 5.83 | 12.83 |
| 7 | 1823–May | 1829–Nov | 119 | 6.50 | 10.50 |
| 8 | 1833–Nov | 1837–Mar | 245 | 3.33 | 9.67 |
| 9 | 1843–Jul | 1848–Feb | 220 | 4.58 | 12.42 |
| 10 | 1855–Dec | 1860–Feb | 186 | 4.17 | 11.25 |
| 11 | 1867–Mar | 1870–Aug | 234 | 3.42 | 11.75 |
| 12 | 1878–Dec | 1883–Dec | 124 | 5.00 | 11.25 |
| 13 | 1890–Mar | 1894–Jan | 147 | 3.83 | 11.83 |
| 14 | 1902–Jan | 1906–Feb | 107 | 4.08 | 11.50 |
| 15 | 1913–Jul | 1917–Aug | 176 | 4.08 | 10.08 |
| 16 | 1923–Aug | 1928–Apr | 130 | 4.67 | 10.08 |
| 17 | 1933–Sep | 1937–Apr | 199 | 3.58 | 10.42 |
| 18 | 1944–Feb | 1947–May | 219 | 3.25 | 10.17 |
| 19 | 1954–Apr | 1958–Mar | 285 | 3.92 | 10.50 |
| 20 | 1964–Oct | 1968–Nov | 157 | 4.08 | 11.42 |
| 21 | 1976–Mar | 1979–Dec | 233 | 3.75 | 10.50 |
| 22 | 1986–Sep | 1989–Nov | 213 | 3.17 | 9.92 |
| 23 | 1996–Aug | 2001–Nov | 180 | 5.25 | 12.33 |
| 24 | 2008–Dec | 2014–Apr | 116 | 5.33 | 11.00 |
| 25 | 2019–Dec | 2024–Oct | 161 | 4.83 | nan |
solar_cycles_520.csv (25 cycles) · fit output (JSON).
