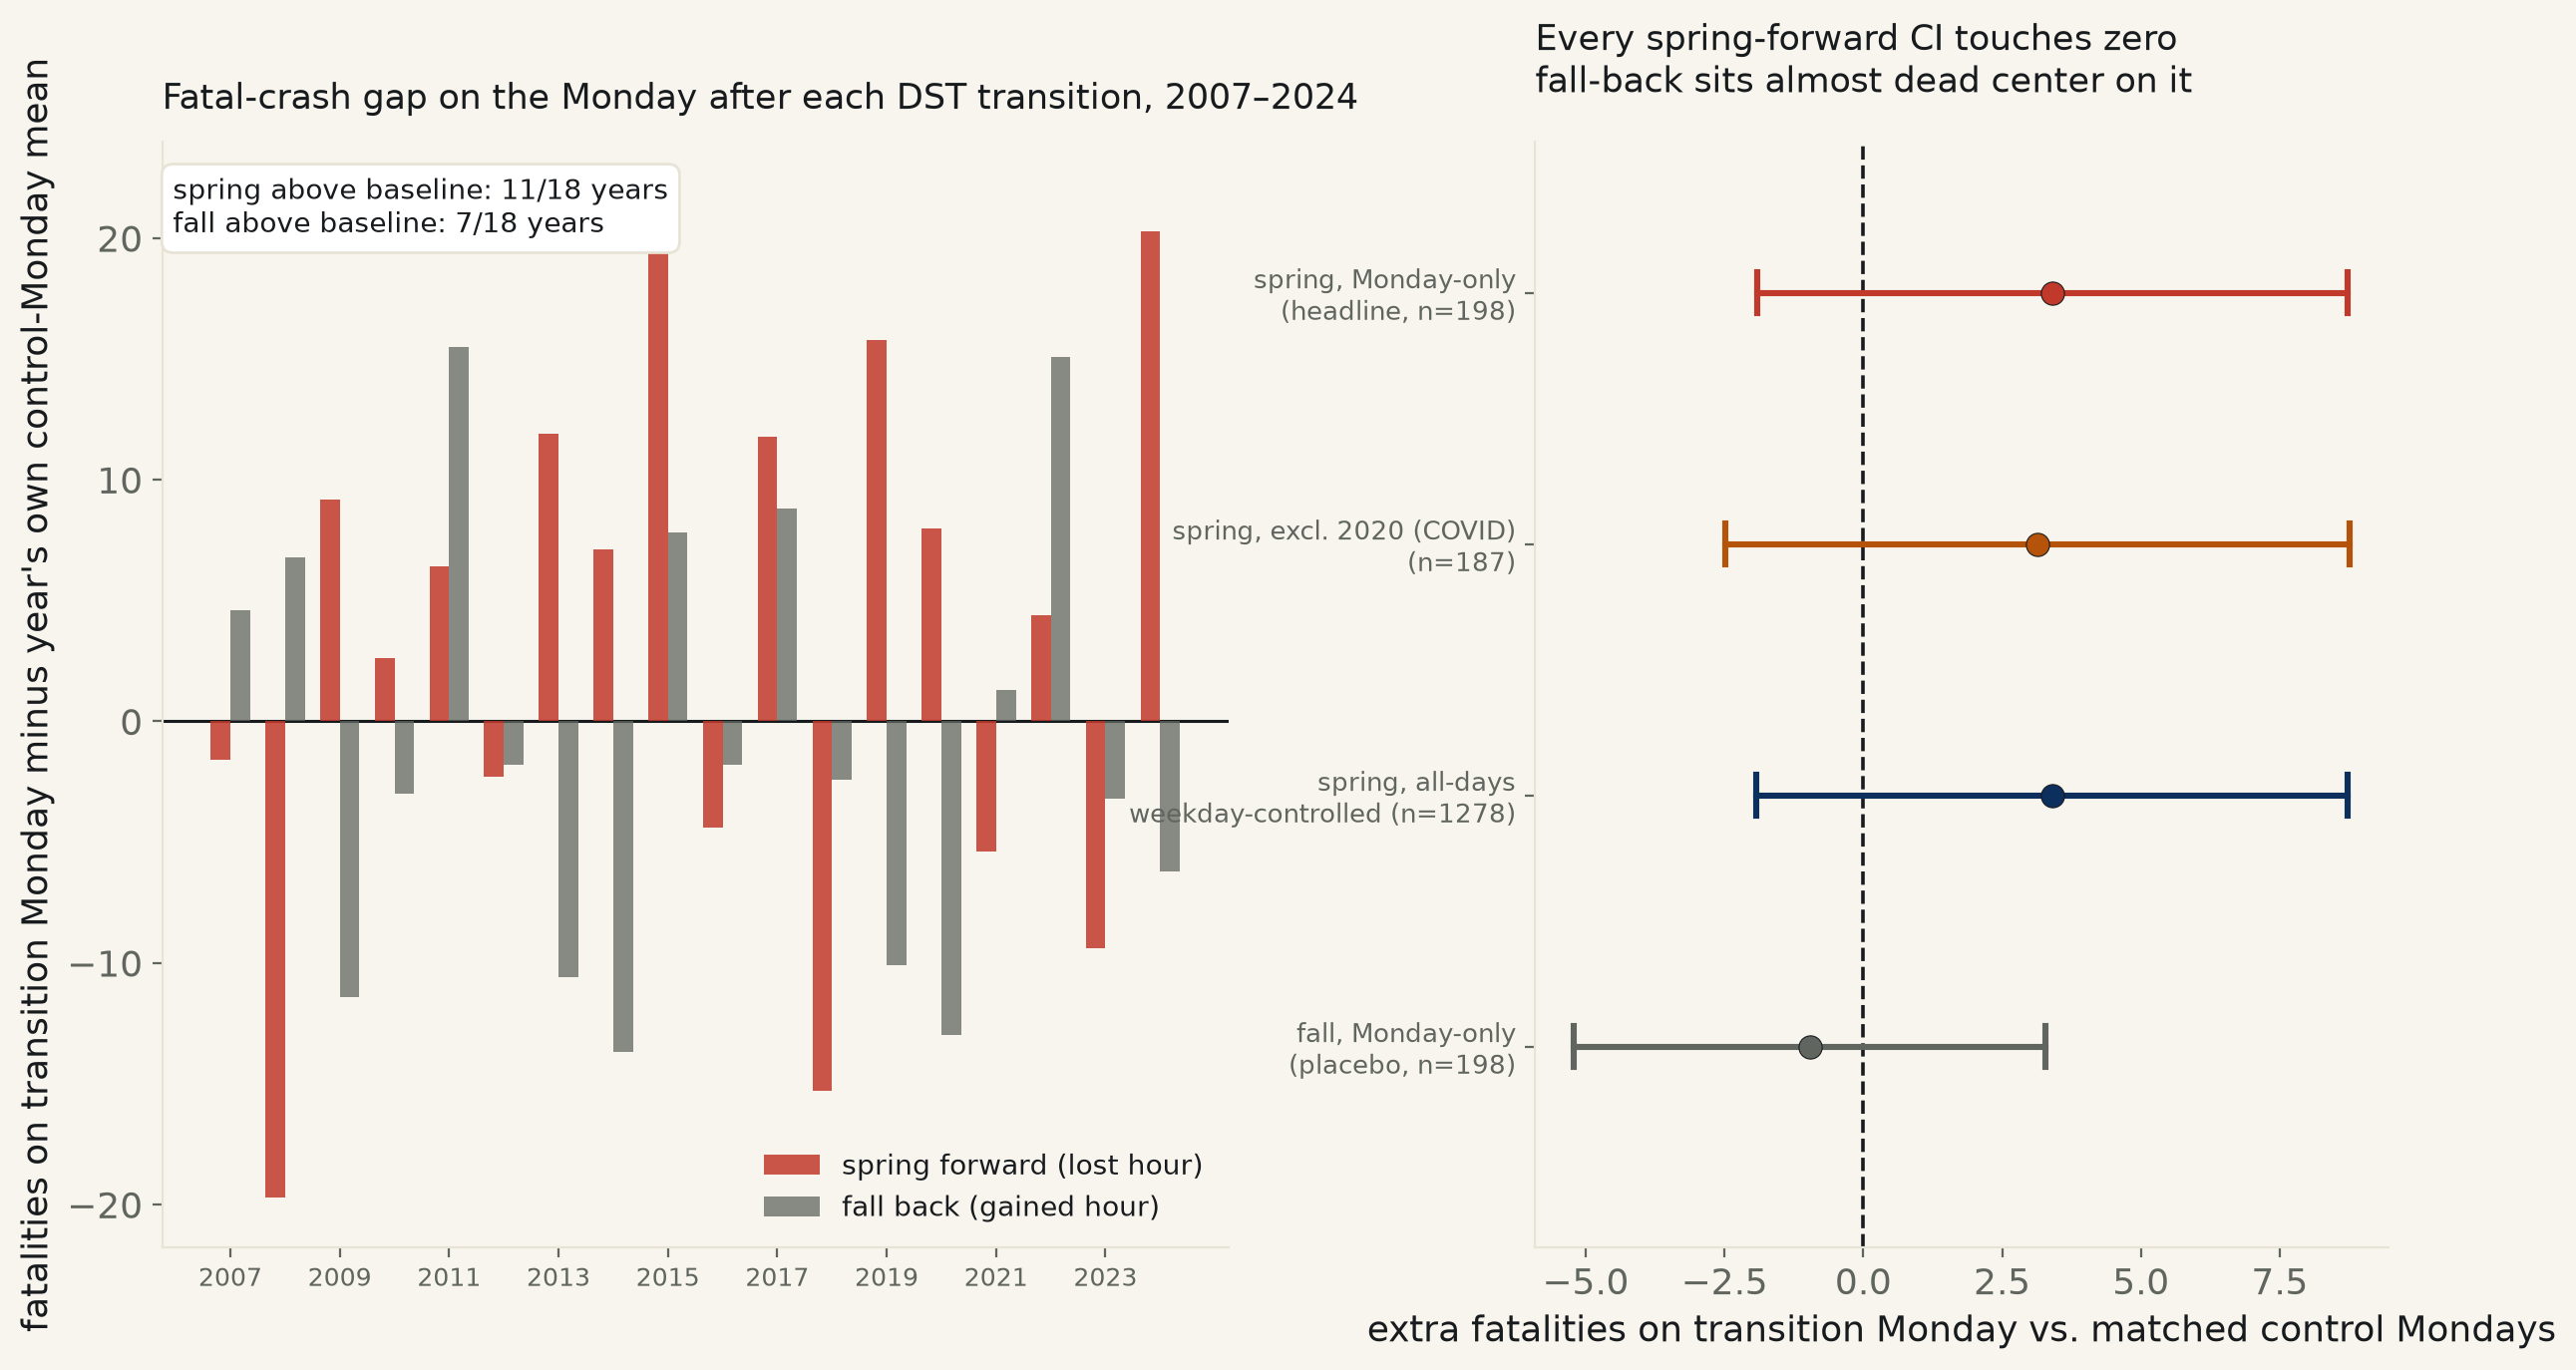
Every Monday within 5 weeks of all 18 US DST transitions since the modern rule began, NHTSA’s own fatal-crash microdata (FARS). The spring-forward Monday averages 84.2 fatalities vs. 80.8 on nearby control Mondays (+3.41, 95% CI [-1.92, +8.73], p=0.21, year-clustered) — the popular claim’s own direction, not far from significant, and still crossing zero. A 4,000-draw bootstrap lands closer: 90.8% of resamples are positive, short of the 95% the desk requires. The fall-back Monday, gaining an hour instead of losing one, comes back almost dead center on zero (-0.96, CI [-5.21, +3.29], p=0.66) — the internal placebo the spring result needs and doesn’t get to lean on.
The claim circulates every March: losing an hour of sleep to daylight saving time makes the roads more dangerous the next day. It has real academic backing (a 2020 Current Biology reanalysis, among others) and real skeptics, and it is exactly the kind of claim this desk exists to check with its own arithmetic rather than borrow someone else's headline. NHTSA's Fatality Analysis Reporting System (FARS) publishes every fatal US crash, date-stamped, going back decades; the modern DST rule (2nd Sunday of March, 1st Sunday of November) has held every year since the Energy Policy Act of 2005 took effect in 2007, giving 18 consecutive, rule-consistent transitions to test — 18 springs-forward and 18 falls-back.
Method, same family as run 111 (Congress in/out of session) and run 517 (shutdowns): compare the treated day only to other days of the identical weekday, so no model has to guess a day-of-week effect away. For each year, every Monday within 5 weeks of that year's transition is pulled from FARS' own crash-level file and summed to a daily fatality count; the transition Monday itself is compared against the other 10 Mondays in its own year's window.
The spring-forward Monday runs hot, in the claimed direction: 84.2 fatalities on average, against 80.8 on the surrounding control Mondays — a gap of +3.41 (4.2%), year-clustered 95% CI [-1.92, +8.73], p=0.21. That interval contains zero — the desk cannot confirm the spring-forward crash spike at conventional significance, on 18 years of federal crash data. A weekday-controlled regression across every day in the window, not just Mondays, returns the identical point estimate (+3.41, CI [-1.92, +8.73]). A 4,000-draw year-cluster bootstrap comes closer without crossing the line the desk uses: 90.8% of resamples land above zero, short of the 95% a real finding needs.
The fall-back Monday — the hour gained back, no sleep lost — is the built-in placebo, and it comes back essentially flat: -0.96 fatalities, CI [-5.21, +3.29], p=0.66, its bootstrap centered near zero (31.5% of draws positive — a coin flip). Counted plainly, not modeled: the spring-forward Monday finished above its own year's baseline in 11 of 18 years; the fall-back Monday, in 7 of 18. A real effect that this data is simply underpowered to certify would look exactly like this — a point estimate with the right sign and the wrong sample size, sitting next to a placebo that shows nothing. That is a description of the evidence, not a finding, and the desk is reporting it as the former.
One robustness check specifically for this dataset: the March 2020 window falls right before the US COVID shutdowns began (the transition Monday, March 9, 2020, predates the national emergency declaration by four days, but several of that year's later control Mondays — deep into lockdown — do not). Dropping 2020 entirely barely moves the estimate (+3.14, CI [-2.48, +8.75], p=0.27; bootstrap 86.2% positive) — the near-miss is not a COVID artifact in either direction.
| Specification | n | extra fatalities | 95% CI | R² | p |
|---|---|---|---|---|---|
| Spring, Monday-only (headline) | 198 | +3.41 | [-1.92, +8.73] | 0.0041 | 0.210 |
| Spring, excl. 2020 (COVID) | 187 | +3.14 | [-2.48, +8.75] | 0.0034 | 0.274 |
| Spring, all-days, weekday-controlled | 1278 | +3.41 | [-1.92, +8.73] | 0.3921 | 0.210 |
| Fall, Monday-only (placebo) | 198 | -0.96 | [-5.21, +3.29] | 0.0003 | 0.657 |
| Fall, excl. 2020 | 187 | -0.25 | [-4.51, +4.00] | 0.0000 | 0.907 |
Bootstrap (4,000 draws, resampled by year): spring gap 95% percentile CI [-1.63, +8.51], 90.8% of draws above zero; fall gap CI [-5.03, +3.18], 31.5% above zero.
Method. Source: NHTSA's FARS National annual CSV releases, 2007–2024 (static.nhtsa.gov, no key), 2,556 day-window rows built from the crash-level accident.csv inside each year's release, summed to daily fatality and crash counts. DST transition Mondays are computed directly from the calendar rule (2nd Sunday of March, 1st Sunday of November), not read off any secondary source. The headline spec regresses each transition day's total fatalities on a 0/1 treatment dummy across every Monday in a 35-day window on each side, restricted to Mondays so no day-of-week adjustment is needed; standard errors are clustered by year since the ~11 Mondays inside one year's window are not independent draws. The all-days spec repeats the test on every day in the window (not just Mondays) with weekday fixed effects, as a cross-check that isn't Monday-only by construction.
Limits, stated plainly. One treated day per year means 18 independent events at most — the same thin-n ceiling run 517 flagged for shutdowns and run 501 flagged for Fed decisions, and it is the reason the point estimate here (a real 4.2% rise, the claimed direction) cannot clear conventional significance even though it is not far off. This run tests only the crash outcome named in backlog idea #100; it does not test the heart-attack half of that idea, which needs day-level CDC mortality data this run did not pull. It also cannot speak to mechanism — the literature's proposed cause is circadian disruption from the lost hour of sleep, but this run has only daily totals, not the hour-of-crash detail that would let it test a morning-rush-hour spike directly.
| Year | Transition | Monday | Fatalities that day | Control-Monday mean | Gap |
|---|---|---|---|---|---|
| 2007 | spring | 2007-03-12 | 91 | 92.6 | -1.6 |
| 2008 | spring | 2008-03-10 | 64 | 83.7 | -19.7 |
| 2009 | spring | 2009-03-09 | 83 | 73.8 | +9.2 |
| 2010 | spring | 2010-03-15 | 70 | 67.4 | +2.6 |
| 2011 | spring | 2011-03-14 | 73 | 66.6 | +6.4 |
| 2012 | spring | 2012-03-12 | 73 | 75.3 | -2.3 |
| 2013 | spring | 2013-03-11 | 84 | 72.1 | +11.9 |
| 2014 | spring | 2014-03-10 | 73 | 65.9 | +7.1 |
| 2015 | spring | 2015-03-09 | 94 | 72.1 | +21.9 |
| 2016 | spring | 2016-03-14 | 86 | 90.4 | -4.4 |
| 2017 | spring | 2017-03-13 | 91 | 79.2 | +11.8 |
| 2018 | spring | 2018-03-12 | 72 | 87.3 | -15.3 |
| 2019 | spring | 2019-03-11 | 89 | 73.2 | +15.8 |
| 2020 | spring | 2020-03-09 | 84 | 76.0 | +8.0 |
| 2021 | spring | 2021-03-15 | 93 | 98.4 | -5.4 |
| 2022 | spring | 2022-03-14 | 100 | 95.6 | +4.4 |
| 2023 | spring | 2023-03-13 | 82 | 91.4 | -9.4 |
| 2024 | spring | 2024-03-11 | 114 | 93.7 | +20.3 |
| 2007 | fall | 2007-11-05 | 107 | 102.4 | +4.6 |
| 2008 | fall | 2008-11-03 | 97 | 90.2 | +6.8 |
| 2009 | fall | 2009-11-02 | 69 | 80.4 | -11.4 |
| 2010 | fall | 2010-11-08 | 77 | 80.0 | -3.0 |
| 2011 | fall | 2011-11-07 | 101 | 85.5 | +15.5 |
| 2012 | fall | 2012-11-05 | 79 | 80.8 | -1.8 |
| 2013 | fall | 2013-11-04 | 66 | 76.6 | -10.6 |
| 2014 | fall | 2014-11-03 | 75 | 88.7 | -13.7 |
| 2015 | fall | 2015-11-02 | 99 | 91.2 | +7.8 |
| 2016 | fall | 2016-11-07 | 102 | 103.8 | -1.8 |
| 2017 | fall | 2017-11-06 | 105 | 96.2 | +8.8 |
| 2018 | fall | 2018-11-05 | 94 | 96.4 | -2.4 |
| 2019 | fall | 2019-11-04 | 84 | 94.1 | -10.1 |
| 2020 | fall | 2020-11-02 | 94 | 107.0 | -13.0 |
| 2021 | fall | 2021-11-08 | 113 | 111.7 | +1.3 |
| 2022 | fall | 2022-11-07 | 121 | 105.9 | +15.1 |
| 2023 | fall | 2023-11-06 | 103 | 106.2 | -3.2 |
| 2024 | fall | 2024-11-04 | 97 | 103.2 | -6.2 |
dst_daily_fatalities_519.csv (2,556 day-level rows, full ±35-day windows) · fit output (JSON).
