Nine federal funding lapses since 1990, S&P 500 daily closes. Three of four day-level specifications find no detectable difference between shutdown-day and normal-day returns (raw OLS p=0.13) — and where there's a point estimate at all, it runs opposite the folklore: shutdown days average slightly higher returns. Concretely, 8 of the 9 shutdowns since 1990 closed with the index higher than when they started.
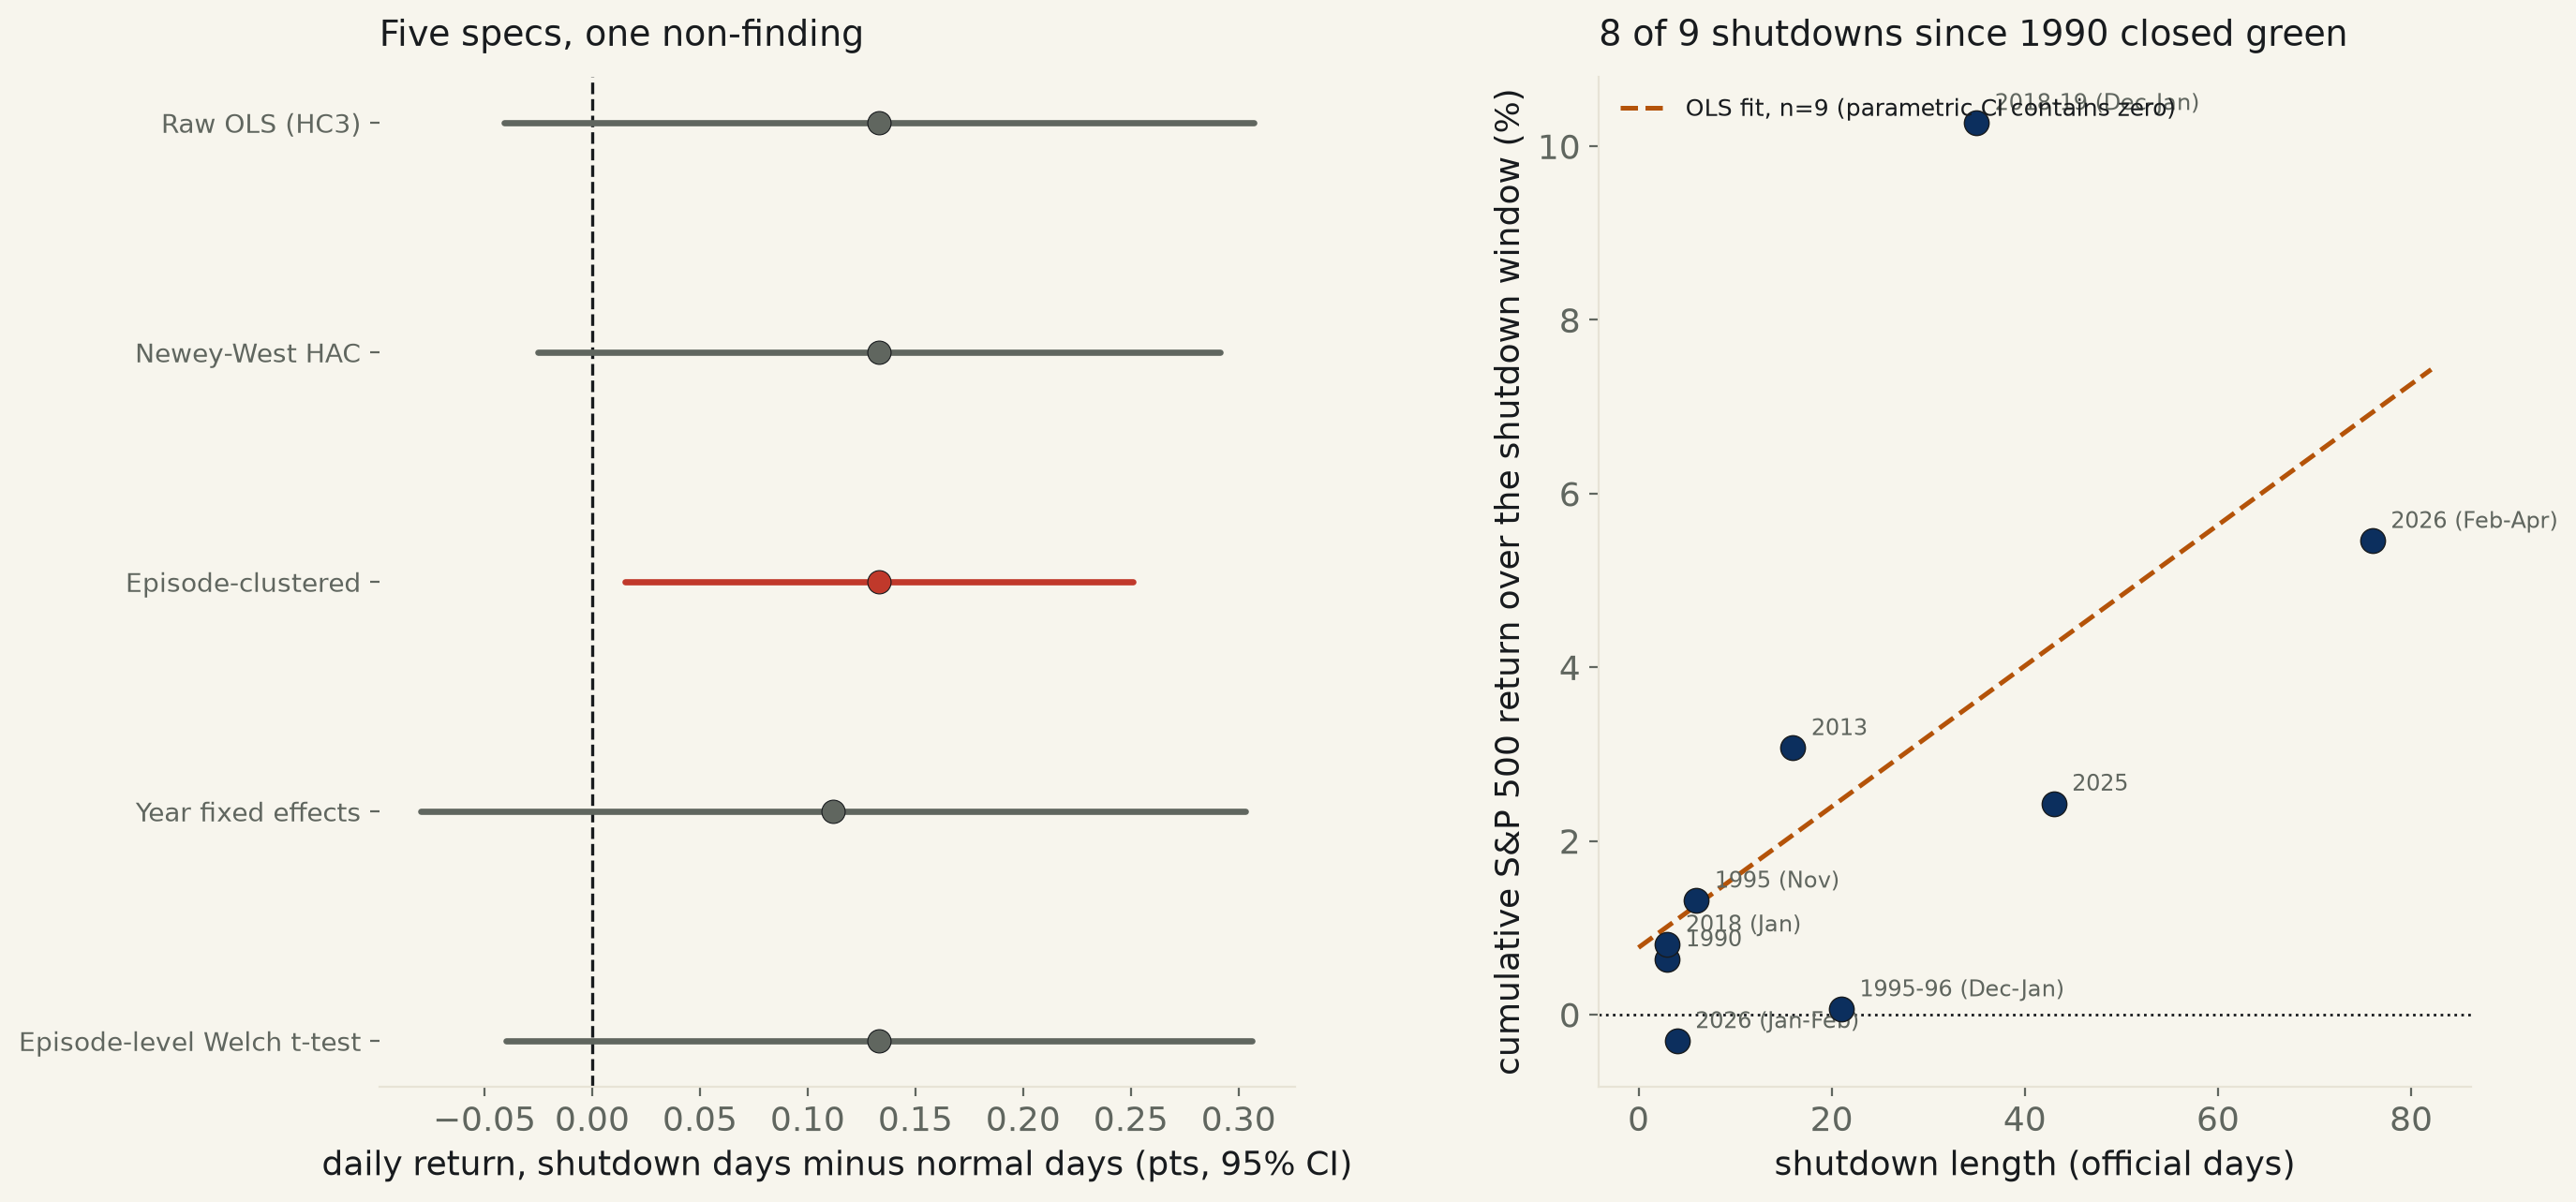
"The market crashes when the government shuts down" is a claim every anchor reaches for the moment funding lapses, and it is testable directly: the federal government has shut down nine times since 1990 (excluding three 1980s lapses of a few hours to a day, whose exact trading-relevant dates are not cleanly recoverable), each with a public start and end date, against a public S&P 500 daily close. Two designs, because a 9-event sample is too thin to trust alone and a 9,000-day sample can't answer "does a longer shutdown do more damage": a day-level comparison of every trading day since 1990 (9,227 days, 139 of them inside a shutdown), and an event-level regression of each shutdown's own cumulative return against its length.
The day-level answer is a near-null with one exception. Three of four specifications return a confidence interval that contains zero: raw OLS (HC3) +0.133 points/day (CI [-0.041, +0.307], p=0.133), Newey-West HAC p=0.099, and year fixed effects (only 8 of 37 years since 1990 contain any shutdown day at all, so this spec runs on a thin 1,924-day subsample) p=0.252. The one exception, episode-clustered SEs, narrowly excludes zero (CI [+0.0150, +0.2512], p=0.027) — reported, not led with, because clustering on only 9 shutdown episodes against roughly a dozen wildly larger normal-market episodes (one running thousands of days) is exactly the kind of small, unbalanced cluster count that makes a cluster-robust interval unreliable. What every spec agrees on: the point estimate runs the opposite direction from the folklore. Shutdown-day returns average higher, not lower, than normal days — 0.171% vs 0.038% — not a finding either, just the sign worth noting before anyone reads this as confirming the scare headline.
The concrete record backs that up: 8 of the 9 shutdowns since 1990 closed with the S&P higher at the end of the window than the start — only the brief 2026 (Jan-Feb) shutdown closed lower (-0.31%), and even the 1990 shutdown's single trading day inside the window closed positive. Regressing each shutdown's own cumulative return on its length in days (n=9) gives a positive slope, +0.0811 points of cumulative return per additional day — but the parametric interval still contains zero (CI [-0.0301, +0.1924], p=0.153), while a 4,000-draw bootstrap puts only 1% of resampled slopes at or below zero (CI [+0.0321, +0.2994]) — the two disagree, and with n=9 this is reported as an unresolved near-miss, not a confirmed "longer shutdowns are better for stocks" finding.
Part of that slope is mechanical, not a shutdown effect at all: a longer window simply compounds more of the market's ordinary positive drift, the same "compounding-exposure illusion" the companion Congress-session run (111) named directly. Using this sample's own normal-day mean return (0.0378%/day) and the observed trading-day-to-calendar-day ratio across these nine windows, drift alone predicts a slope of about +0.0222 points/day — the fitted slope (+0.0811) runs roughly 3.6× that, so drift is not the whole story, but with 9 events and two of them (2013, 2018-19) carrying outsized returns, it is not a story this run can separate cleanly from noise either. Post-resolution, the 21 trading days after a shutdown ends average a +1.46% cumulative return (CI [-0.74, +3.67]) — also contains zero; no detectable relief rally once funding resumes, either.
| specification | slope (shutdown − normal, pts/day) | 95% CI | p | n | verdict |
|---|---|---|---|---|---|
| Raw OLS (HC3) | +0.1331 pts | [-0.0407, +0.3069] | 0.133 | 9227 | contains 0 |
| Newey-West HAC | +0.1331 pts | [-0.0250, +0.2912] | 0.099 | 9227 | contains 0 |
| Episode-clustered | +0.1331 pts | [+0.0150, +0.2512] | 0.027 | 9227 | excludes 0 |
| Year fixed effects | +0.1118 pts | [-0.0795, +0.3031] | 0.252 | 1924 | contains 0 |
Episode-level Welch t-test (the honest-n version: 139 shutdown days vs 9,088 normal days, treated as two groups rather than 9,227 independent draws): diff +0.133 pts, CI [-0.040, +0.306], p=0.134 — contains zero, matches the raw OLS exactly (same comparison, different machinery).
| OLS fit = | slope +0.0811 pts/day, 95% CI [-0.0301, +0.1924], R²=0.352, p=0.153 — contains zero |
| bootstrap (4,000 draws) = | CI [+0.0321, +0.2994], only 1% of resampled slopes ≤ 0 — disagrees with the parametric CI; read as small-n instability, not confirmation |
| naive drift-only estimate = | +0.0222 pts/day of window length, from ordinary market drift alone (no shutdown effect) — the fitted slope is 3.6× that, so drift does not explain all of it |
| post-resolution rebound = | 21-trading-day return after a shutdown ends: +1.46%, CI [-0.74, +3.67] — contains zero, no detectable relief rally |
| shutdown | official days | trading days | S&P 500 return over the window |
|---|---|---|---|
| 1990 | 3 | 1 | +0.64% |
| 1995 (Nov) | 6 | 4 | +1.31% |
| 1995-96 (Dec-Jan) | 21 | 13 | +0.06% |
| 2013 | 16 | 13 | +3.07% |
| 2018 (Jan) | 3 | 1 | +0.81% |
| 2018-19 (Dec-Jan) | 35 | 22 | +10.27% |
| 2025 | 43 | 31 | +2.43% |
| 2026 (Jan-Feb) | 4 | 2 | -0.31% |
| 2026 (Feb-Apr) | 76 | 52 | +5.45% |
Method. Nine shutdown windows since 1990, dates pulled directly from Wikipedia's own shutdown articles (raw wikitext, deterministic parse of each article's infobox {{start and end dates}} template or explicit lead-sentence dates, not an LLM summary) — every window is documented with its source sentence in fetch_shutdown_517.py. Excludes three 1981/1984/1986 funding lapses of 1-4 hours to a day, whose precise trading-relevant dates were not cleanly recoverable from the source and whose duration is not comparable to the 3-76 day events used here. S&P 500 daily closes are Yahoo Finance's own ^GSPC series via yfinance, no key required. Day-level analysis flags every trading day 1990-01-02 onward in_shutdown = 1 if it falls inside any window (inclusive of both endpoints) and compares mean daily return across four independent specifications, the same discipline as run 111's Congress in/out-of-session test. Event-level analysis computes each window's own compounded return across its trading days and regresses that against the shutdown's official length.
Limits, stated plainly. n=9 shutdown events is a small sample by any standard, and this run's event-level regression should not be read past what a 9-point fit can support — the disagreement between its parametric and bootstrap confidence intervals is reported precisely because it is unresolved, not smoothed into a clean story. The episode-clustered day-level spec narrowly excludes zero while three others do not; this is flagged as fragile (very few, wildly unbalanced clusters) rather than either buried or treated as the desk's answer. An event study of this design cannot separate "the shutdown itself moved the market" from "whatever else was happening that month" — 2018-19's shutdown overlapped a sharp broader equity selloff and rebound with its own well-documented causes (Fed policy, trade-war headlines), and this run does not attempt to net those out. No causal claim is made in either direction.
sp500_daily_517.csv · shutdown_events_517.csv · fit output (JSON).
^GSPC via yfinance. Shutdown dates: Wikipedia, Government shutdowns in the United States (overview table) plus each shutdown's own article (1990; 1995–1996; 2013; January 2018; 2018–2019; 2025; 2026). Retrieved 2026-08-22.
