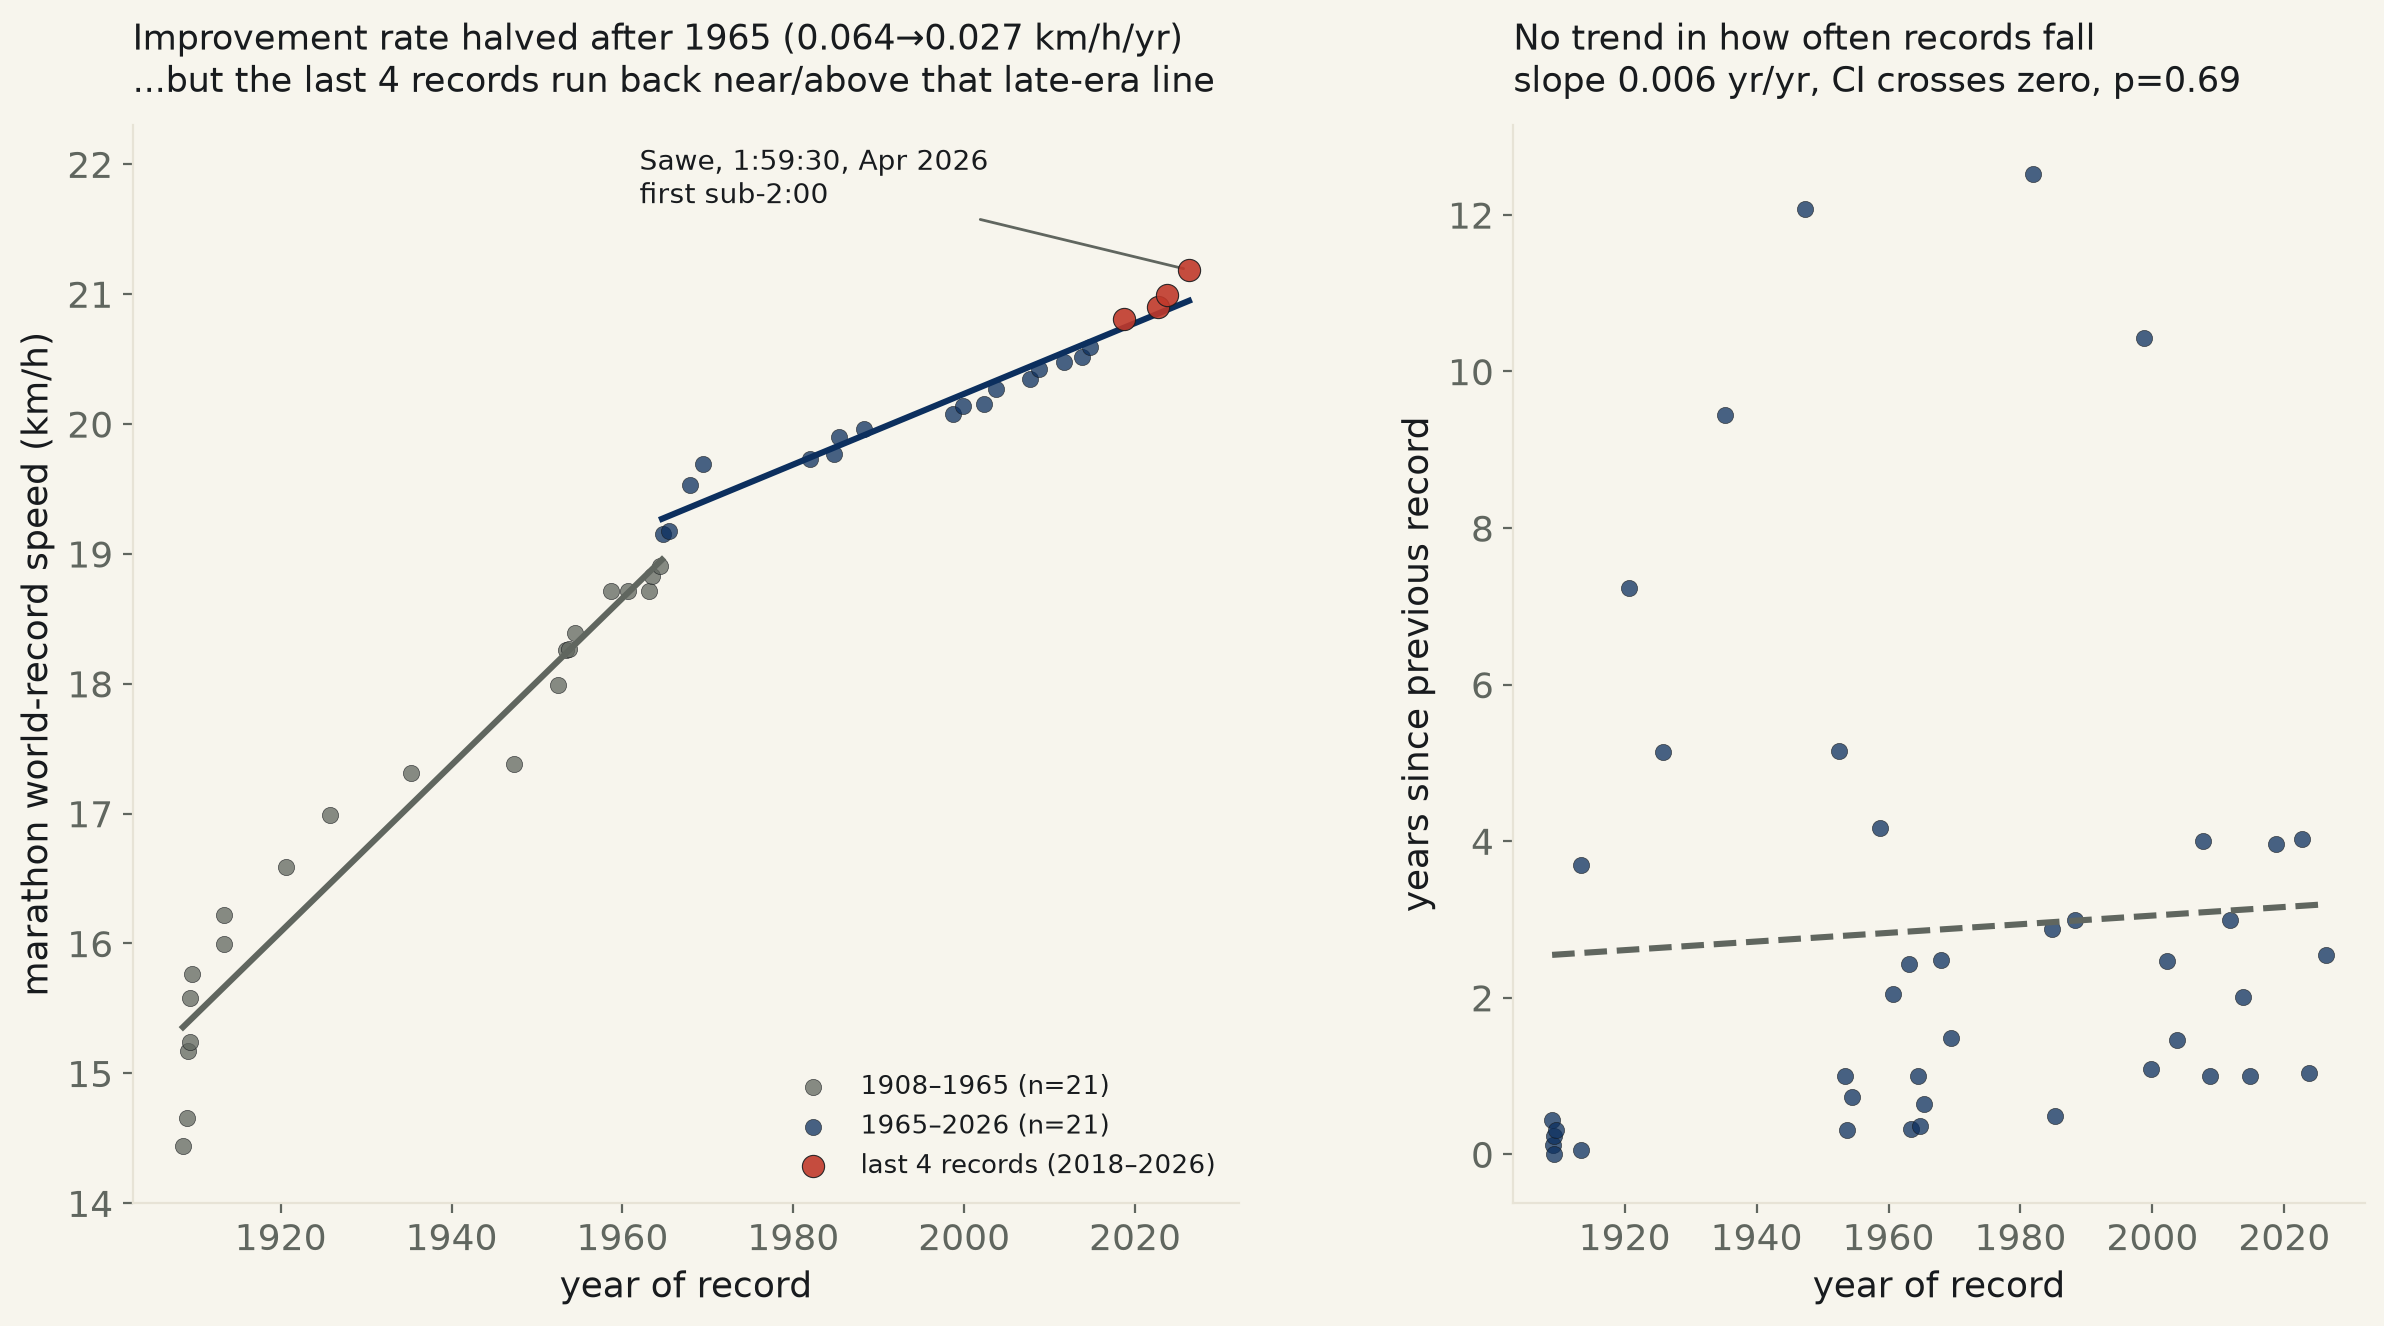
Cleaned to the true best-ever-to-date progression (42 men’s records, 1908–2026), the improvement rate really did halve: +0.064 km/h/yr before 1965 to +0.027 after (95% CI on the gap [-0.046, -0.028], p=1.6e-10) — the “near the limit” story, confirmed, for the 20th century. But the last 9 records (2006–2026) improved at +0.042 km/h/yr, almost back to the century average, and Sabastian Sawe’s 1:59:30 (Apr 2026, the first sub-2:00:00) lands +1.1% above where the post-1965 line predicted — not below it.
“The marathon world record is approaching a hard physiological wall” is a claim with real pedigree — exercise physiologists spent a decade and a half arguing about whether a sub-2:00:00 marathon was even biologically possible, and as recently as 2019 the only person to run one (Eliud Kipchoge, Vienna) did it in a shoe-and-pacing setup deliberately ineligible for record purposes. This run tests the claim against the actual 118-year record book rather than against the argument.
Source: Wikipedia’s Marathon world record progression page, itself sourced record-by-record to World Athletics/IAAF and the Association of Road Racing Statisticians (ARRS) — 53 men’s rows and 42 women’s rows as published. Before a single global ratifying body took over marathon records in 2003, IAAF and the independent ARRS tracked overlapping lists, so the raw table contains 11 men’s and 8 women’s entries that do not actually beat the mark before them (disputed-course or dual-authority marks). Nothing here edits a time or drops a row for any reason except that test: rows are kept only if they beat every prior time, recovering the true best-ever-to-date progression — 42 men’s records and 34 women’s records survive. One honesty note carries through every fit below: a series of records is not a series of independent measurements — by construction every point is a new extreme — so these p-values describe this specific 118-year history, not a formal guarantee about some population of alternate histories, in the same spirit as this desk's flags on run 027's repetition-preserving surrogates and run 028's non-independent months.
The long-run claim holds up. Split the 42 men’s records at their median year (1965) and fit each half separately: +0.064 km/h/yr before 1965 (n=21, R²=0.94) falls to +0.027 km/h/yr after (n=21, R²=0.95) — the rate of improvement roughly halved. Testing the difference directly (an interaction term in one combined regression) puts the gap at -0.0370 km/h/yr, 95% CI [-0.0456, -0.0283] — nowhere near zero, p=1.6e-10. Over the full century-plus, this is real: the marathon did slow down.
But “did” is the operative tense. Restrict the same fit to just the last 20 years — the 9 records set 2006–2026 — and the rate climbs back to +0.042 km/h/yr (95% CI [+0.036, +0.049], R²=0.97) — 1.6× the post-1965 rate and within a hair of the +0.049 km/h/yr century-long average. Sabastian Sawe’s 2026 1:59:30 (Nairobi’s runner, London Marathon, the first record-eligible sub-2:00:00) sits +1.13% above where the post-1965 “slow” trend line predicts for 2026, and +0.35% above the last-20-years line — the newest record is not lagging the recent pace, it is running right on it. The plateau this desk can confirm is a 20th-century one; the last two decades don't extend it.
A second, independent test says the same thing from a different angle: if records were coming less often, that alone would support “plateauing” regardless of how big each jump is. They aren’t. Years-between-records, regressed against time across all 41 gaps: slope +0.0055 yr/yr, 95% CI [-0.0222, +0.0332] — contains zero, p=0.69. Descriptively, the four most recent gaps (2018–2026) averaged 2.89 years against 1.75 for the four before them — noisier, not conclusive at n=4 each, and not the story the speed data tells: the last four records were each unusually large drops (Kipchoge’s two, then Kiptum’s 34 seconds, then Sawe’s 65), not small chips off a wall.
The likeliest driver of the reacceleration is not physiology, and the run says so plainly rather than crediting it to human improvement it can’t isolate: every one of the last four records (2018 onward) was run in a carbon-plated “super shoe” (Nike’s Vaporfly/Alphafly line and its rivals, commercialized from 2017), a documented multi-percent efficiency gain nobody in the earlier eras had access to. This run cannot separate how much of the last decade’s reacceleration is the shoe versus the athlete — it can only report that the deceleration this desk can confirm stopped right around when the equipment changed.
| Specification | n | slope (km/h/yr) | 95% CI | R² | p |
|---|---|---|---|---|---|
| full history, 1908–2026 | 42 | +0.0491 | [+0.0451, +0.0531] | 0.939 | 5.99e-26 |
| Era (men’s WR) | n | slope (km/h/yr) | 95% CI | R² | p |
|---|---|---|---|---|---|
| 1908–1965 (early half) | 21 | +0.0642 | [+0.0563, +0.0721] | 0.938 | 6.32e-13 |
| 1965–2026 (late half) | 21 | +0.0272 | [+0.0243, +0.0302] | 0.952 | 5.97e-14 |
| 2006–2026 (last 9 records) | 9 | +0.0425 | [+0.0362, +0.0487] | 0.973 | 9.09e-07 |
Interaction test (late slope − early slope, one combined regression): -0.0370 km/h/yr, CI [-0.0456, -0.0283], p=1.6e-10, whole-model R²=0.980.
The newest record undershoots the single straight line fit across the whole discontinuous 118-year history (which blends a fast era and a slow one), but sits at or above both era-appropriate trend lines — the more honest comparisons.
Contains zero. Last 4 gaps (2018–2026) averaged 2.89 yrs vs. 1.75 yrs for the 4 before — descriptive only, n=4 each, not fit or tested.
| Specification | n | slope (km/h/yr) | 95% CI | R² | p |
|---|---|---|---|---|---|
| full history, 1918–2024 | 34 | +0.1103 | [+0.0925, +0.1281] | 0.832 | 5.89e-14 |
| early half (to 1977) | 17 | +0.1147 | [+0.0802, +0.1492] | 0.770 | 3.74e-06 |
| late half (from 1977) | 17 | +0.0529 | [+0.0411, +0.0647] | 0.859 | 8.98e-08 |
Interaction (deceleration test): -0.0618 km/h/yr, CI [-0.0969, -0.0267], p=0.0011. Newest record (Chepng’etich, 2:09:56, 2024-10-13) vs. late-era trend: +0.26%.
The women’s record (Wikipedia’s continuous “world record” series — unrestricted before the 2003 mixed/women-only split, then the mixed-pacing figure after, matching how the men’s record has always been defined) shows the identical shape on a shorter, noisier history: 34 cleaned records, 1918–2024. Split at the median year (1977): +0.115 km/h/yr early (n=17) to +0.053 km/h/yr late (n=17) — again roughly halved, interaction -0.0618, CI [-0.0969, -0.0267], p=0.0011. The newest record — Ruth Chepng’etich, 2:09:56, Chicago 2024 — sits +0.26% from the late-era trend line, essentially on it, the same catch-up pattern as the men’s record.
One caveat that has to be stated with this specific record, not buried: Chepng’etich was banned in October 2025 for three years for the presence and use of hydrochlorothiazide. World Athletics’ own ruling lets results before her March 2025 positive sample stand, which keeps this October 2024 mark on the books — but a reader weighing how much to trust the newest data point in this series should know the doping finding exists, not learn about it elsewhere. The women’s record also sat unbroken for nearly 16 years (2003–2019) before the same supershoe-era burst that reaccelerated the men’s record — three record drops in five years (2019, 2023, 2024) after a sixteen-year gap is exactly the kind of discontinuity a linear era-split model smooths over rather than explains.
Method. Both tables on Wikipedia's Marathon world record progression page (men's, women's), each row sourced to World Athletics/IAAF or the ARRS, scraped 95 raw rows total. Times parsed to seconds and converted to speed (42.195 km / time). Rows are kept only if their time beats every prior time in the same series (a running-minimum filter) — this removes 11 men's and 8 women's rows that reflect the pre-2003 dual-authority (IAAF vs. ARRS) tracking rather than an actual new best. The women's series uses the continuous “world record” definition — unrestricted before the 2003 split into mixed-pacing and women-only records, the “Mx”-tagged mixed record after — to match how the men's record has always been defined (mixed-gender pacing has never been restricted for men). Era splits use each series' own median record-year. The interaction test (deceleration or its reversal) is a single OLS regression of speed on year, era, and their interaction, so the reported gap and its CI/p come from one model rather than an eyeballed comparison of two separate CIs. All fits are ordinary least squares with conventional standard errors.
Limits, stated plainly. This is a series of records, not repeated independent draws — every point is by definition a new extreme, so these standard errors describe this one historical sequence, not a formal sampling distribution over alternate histories; treat significance here as descriptive weight, not textbook inference. The recent-era fit (n=9 for men, and the women's series has an even sparser recent history with a 16-year gap 2003–2019) is a small sample, so its own CI is correspondingly wide even though it excludes zero. This run identifies that the deceleration reversed around when carbon-plated shoes became standard (2017 onward) but cannot partition how much of the reacceleration is the shoe technology versus training, professionalization, or pacing-strategy changes over the same years — it reports the coincidence in timing, not a mechanism. The women's newest record carries a doping-ban caveat specific to that athlete, detailed above. Course record-eligibility rules (elevation drop, point-to-point certification) changed over this period in ways this run does not separately model; it takes each body's own recognition of a mark as given.
| Date | Time | Name | Nationality | Speed (km/h) |
|---|---|---|---|---|
| 1908-07-24 | 2:55:18.4 | Johnny Hayes | United States | 14.442 |
| 1909-01-01 | 2:52:45.4 | Robert Fowler | United States | 14.655 |
| 1909-02-12 | 2:46:52.8 | James Clark | United States | 15.171 |
| 1909-05-08 | 2:46:04.6 | Albert Raines | United States | 15.244 |
| 1909-05-08 | 2:42:31.0 | Henry Barrett | United Kingdom | 15.578 |
| 1909-08-31 | 2:40:34.2 | Thure Johansson | Sweden | 15.767 |
| 1913-05-12 | 2:38:16.2 | Harry Green | United Kingdom | 15.996 |
| 1913-05-31 | 2:36:06.6 | Alexis Ahlgren | Sweden | 16.217 |
| 1920-08-22 | 2:32:35.8 | Hannes Kolehmainen | Finland | 16.591 |
| 1925-10-12 | 2:29:01.8 | Albert Michelsen | United States | 16.988 |
| 1935-03-21 | 2:26:14 | Sohn Kee-chung | Japanese Korea | 17.313 |
| 1947-04-19 | 2:25:39 | Suh Yun-bok | Korea | 17.382 |
| 1952-06-14 | 2:20:42.2 | Jim Peters | United Kingdom | 17.993 |
| 1953-06-13 | 2:18:40.4 | Jim Peters | United Kingdom | 18.257 |
| 1953-10-04 | 2:18:34.8 | Jim Peters | United Kingdom | 18.269 |
| 1954-06-26 | 2:17:39.4 | Jim Peters | United Kingdom | 18.391 |
| 1958-08-24 | 2:15:17.0 | Sergei Popov | Soviet Union | 18.714 |
| 1960-09-10 | 2:15:16.2 | Abebe Bikila | Ethiopia | 18.716 |
| 1963-02-17 | 2:15:15.8 | Toru Terasawa | Japan | 18.717 |
| 1963-06-15 | 2:14:28 | Leonard Edelen | United States | 18.828 |
| 1964-06-13 | 2:13:55 | Basil Heatley | United Kingdom | 18.905 |
| 1964-10-21 | 2:12:11.2 | Abebe Bikila | Ethiopia | 19.152 |
| 1965-06-12 | 2:12:00 | Morio Shigematsu | Japan | 19.180 |
| 1967-12-03 | 2:09:36.4 | Derek Clayton | Australia | 19.534 |
| 1969-05-30 | 2:08:33.6 | Derek Clayton | Australia | 19.693 |
| 1981-12-06 | 2:08:18 | Robert de Castella | Australia | 19.733 |
| 1984-10-21 | 2:08:05 | Steve Jones | United Kingdom | 19.766 |
| 1985-04-20 | 2:07:12 | Carlos Lopes | Portugal | 19.903 |
| 1988-04-17 | 2:06:50 | Belayneh Dinsamo | Ethiopia | 19.961 |
| 1998-09-20 | 2:06:05 | Ronaldo da Costa | Brazil | 20.080 |
| 1999-10-24 | 2:05:42 | Khalid Khannouchi | Morocco | 20.141 |
| 2002-04-14 | 2:05:38 | Khalid Khannouchi | United States | 20.151 |
| 2003-09-28 | 2:04:55 | Paul Tergat | Kenya | 20.267 |
| 2007-09-30 | 2:04:26 | Haile Gebrselassie | Ethiopia | 20.346 |
| 2008-09-28 | 2:03:59 | Haile Gebrselassie | Ethiopia | 20.420 |
| 2011-09-25 | 2:03:38 | Patrick Makau | Kenya | 20.477 |
| 2013-09-29 | 2:03:23 | Wilson Kipsang | Kenya | 20.519 |
| 2014-09-28 | 2:02:57 | Dennis Kimetto | Kenya | 20.591 |
| 2018-09-16 | 2:01:39 | Eliud Kipchoge | Kenya | 20.811 |
| 2022-09-25 | 2:01:09 | Eliud Kipchoge | Kenya | 20.897 |
| 2023-10-08 | 2:00:35 | Kelvin Kiptum | Kenya | 20.995 |
| 2026-04-26 | 1:59:30 | Sabastian Sawe | Kenya | 21.186 |
| Date | Time | Name | Nationality | Speed (km/h) |
|---|---|---|---|---|
| 1918-09-29 | 5:40 | Marie-Louise Ledru | France | 7.446 |
| 1926-10-03 | 3:40:22 | Violet Piercy | United Kingdom | 11.489 |
| 1963-12-16 | 3:37:07 | Merry Lepper | United States | 11.661 |
| 1964-05-23 | 3:27:45 | Dale Greig | United Kingdom | 12.186 |
| 1964-07-21 | 3:19:33 | Mildred Sampson | New Zealand | 12.687 |
| 1967-05-06 | 3:14:23 | Maureen Wilton | Canada | 13.024 |
| 1967-09-16 | 3:07:27.2 | Anni Pede-Erdkamp | West Germany | 13.506 |
| 1970-02-28 | 3:02:53 | Caroline Walker | United States | 13.843 |
| 1971-05-09 | 3:01:42 | Elizabeth Bonner | United States | 13.933 |
| 1971-09-19 | 2:55:22 | Elizabeth Bonner | United States | 14.437 |
| 1971-12-05 | 2:49:40 | Cheryl Bridges | United States | 14.922 |
| 1973-12-02 | 2:46:36 | Michiko Gorman | United States | 15.196 |
| 1974-10-27 | 2:46:24 | Chantal Langlacé | France | 15.214 |
| 1974-12-01 | 2:43:54.5 | Jacqueline Hansen | United States | 15.446 |
| 1975-04-21 | 2:42:24 | Liane Winter | West Germany | 15.589 |
| 1975-05-03 | 2:40:15.8 | Christa Vahlensieck | West Germany | 15.797 |
| 1975-10-12 | 2:38:19 | Jacqueline Hansen | United States | 15.991 |
| 1977-05-01 | 2:35:15.4 | Chantal Langlacé | France | 16.306 |
| 1977-09-10 | 2:34:47.5 | Christa Vahlensieck | West Germany | 16.355 |
| 1978-10-22 | 2:32:29.8 | Grete Waitz | Norway | 16.602 |
| 1979-10-21 | 2:27:32.6 | Grete Waitz | Norway | 17.159 |
| 1980-10-26 | 2:25:41.3 | Grete Waitz | Norway | 17.378 |
| 1981-10-25 | 2:25:28 | Allison Roe | New Zealand | 17.404 |
| 1983-04-18 | 2:22:43 | Joan Benoit | United States | 17.739 |
| 1985-04-21 | 2:21:06 | Ingrid Kristiansen | Norway | 17.943 |
| 1998-04-19 | 2:20:47 | Tegla Loroupe | Kenya | 17.983 |
| 1999-09-26 | 2:20:43 | Tegla Loroupe | Kenya | 17.991 |
| 2001-09-30 | 2:19:46 | Naoko Takahashi | Japan | 18.114 |
| 2001-10-07 | 2:18:47 | Catherine Ndereba | Kenya | 18.242 |
| 2002-10-13 | 2:17:18 | Paula Radcliffe | United Kingdom | 18.439 |
| 2003-04-13 | 2:15:25 Mx | Paula Radcliffe | United Kingdom | 18.696 |
| 2019-10-13 | 2:14:04 Mx | Brigid Kosgei | Kenya | 18.884 |
| 2023-09-24 | 2:11:53 Mx | Tigst Assefa | Ethiopia | 19.197 |
| 2024-10-13 | 2:09:56 Mx | Ruth Chepng'etich | Kenya | 19.485 |
marathon_wr_progression.csv (all 95 raw rows, before the running-minimum filter) · fit output (JSON).
