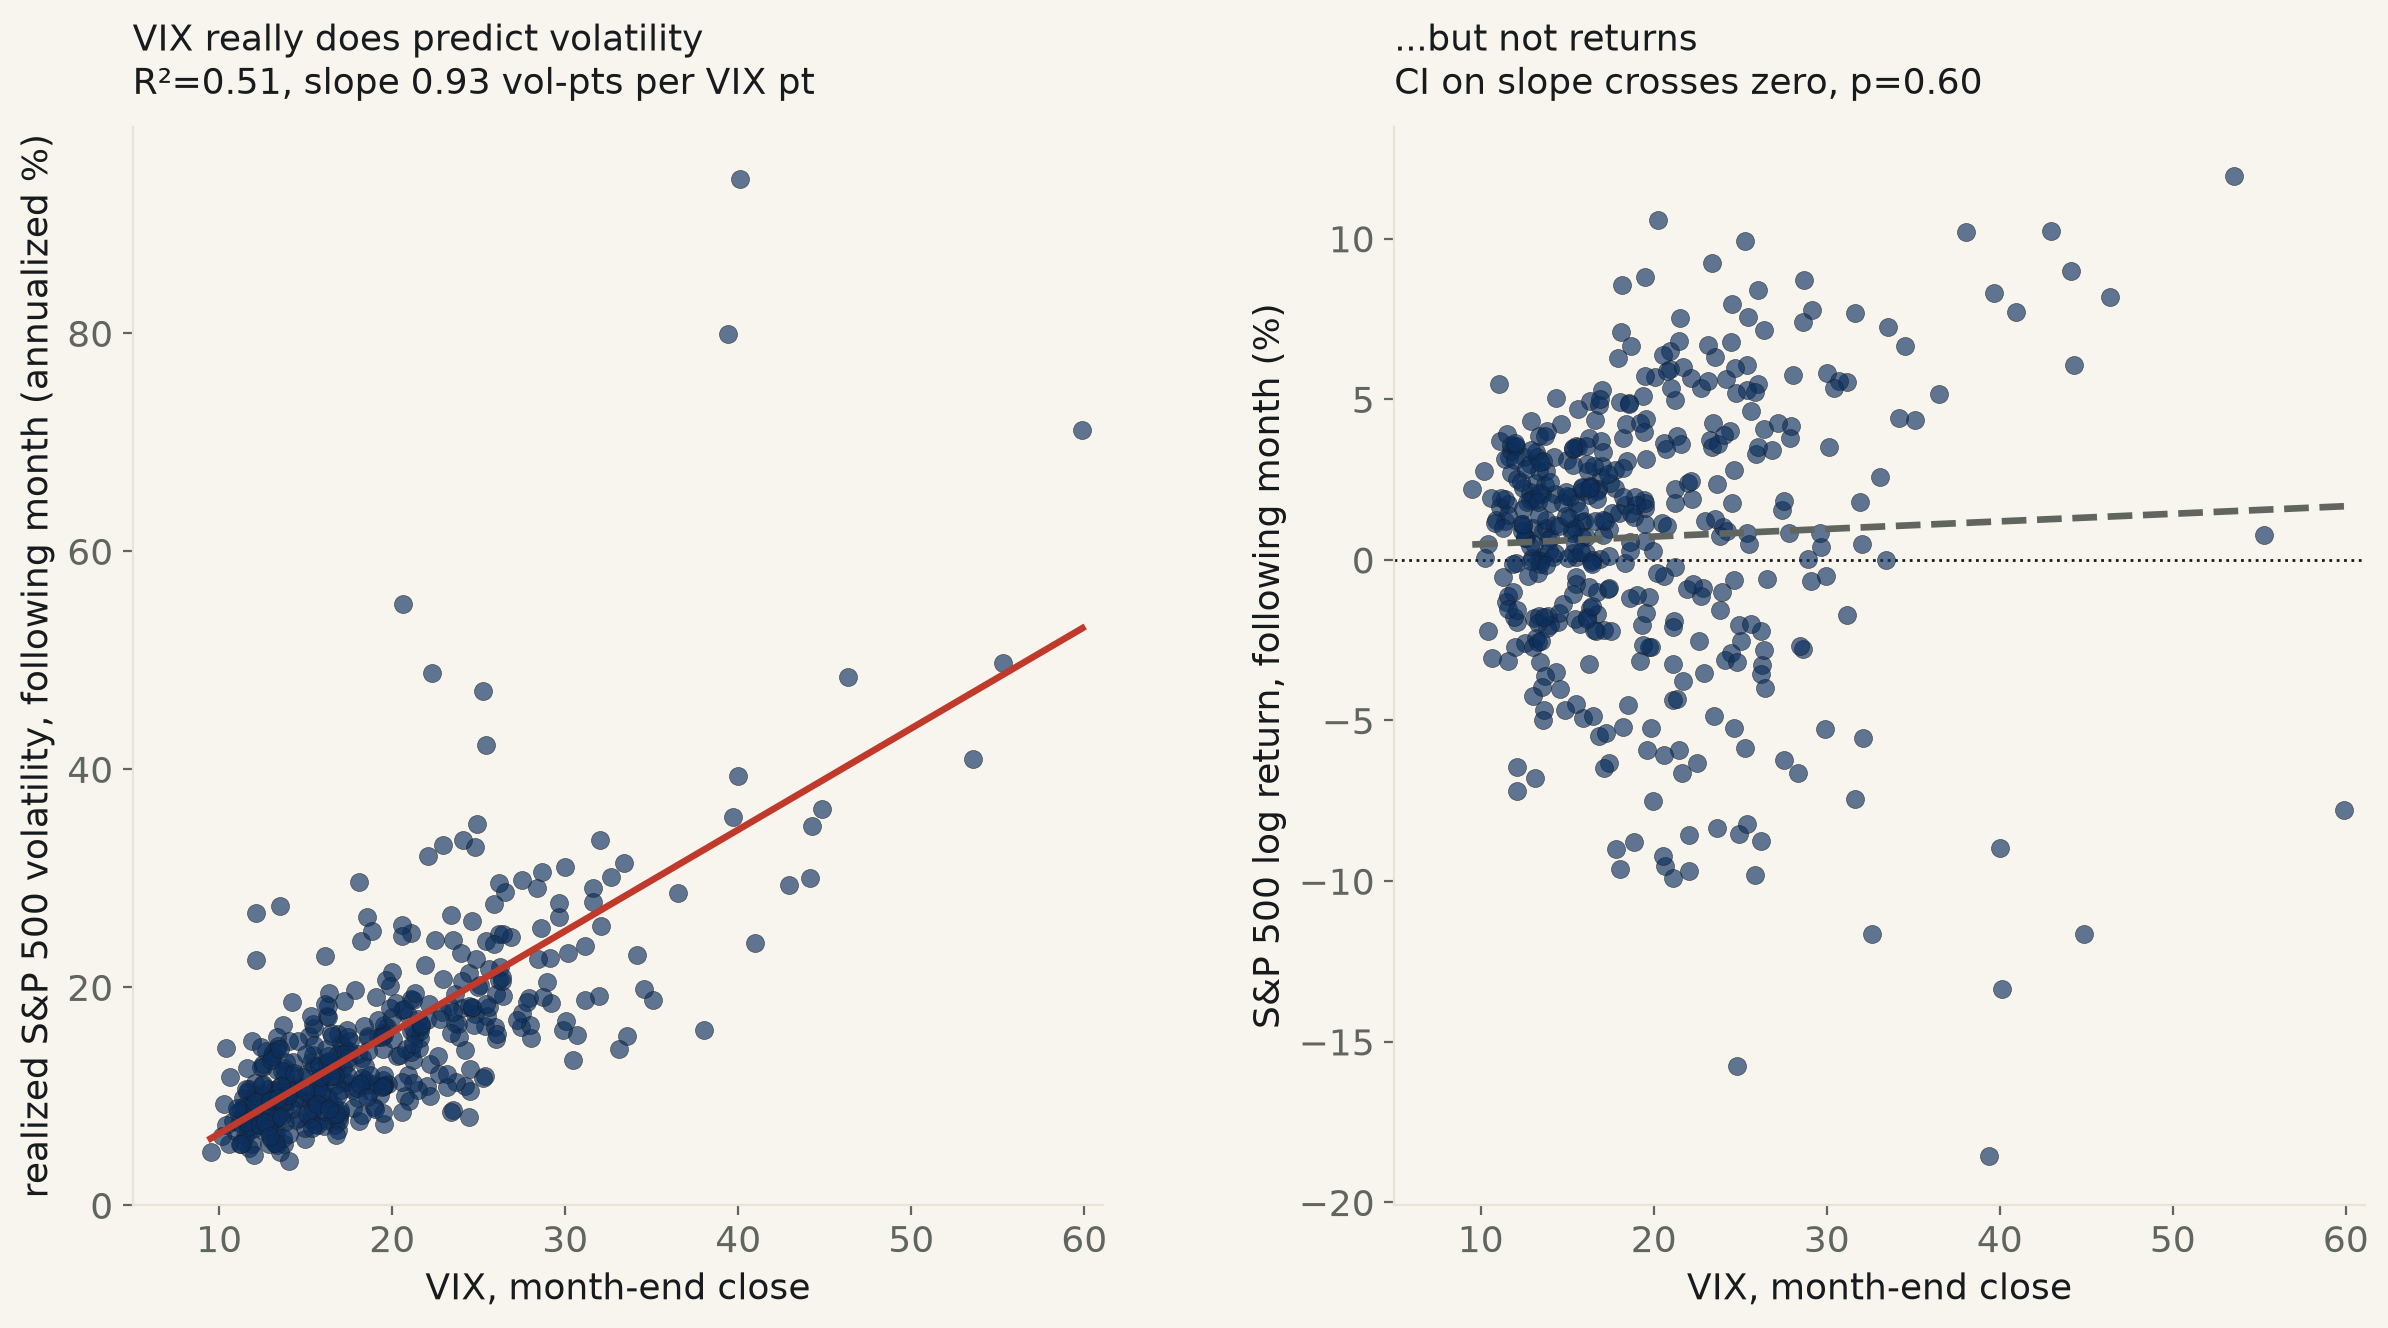
438 non-overlapping calendar months, 1990-01–2026-06: the VIX's own month-end close paired with the S&P 500's realized volatility and log return the following month. The VIX prices next month's volatility well — +0.93 vol-points per VIX point (95% CI [+0.77, +1.09], R²=0.51) — and has nothing to say about next month's return (+0.0236%/pt, CI [-0.0653, +0.1125], R²=0.0017). It is also a biased predictor of the thing it does predict: the VIX overshoots the realized volatility that follows it by +4.10 points a year on average, true in 83% of months — the volatility risk premium option sellers are paid to bear.
The VIX (the CBOE's "fear gauge") is built directly from S&P 500 option prices to be a model-free estimate of the market's own expected volatility over the next 30 calendar days. That construction gets two very different popular claims attached to it, and this run keeps them apart on purpose: that a high VIX warns of wild moves ahead (true by design, but checked here against what actually happened rather than assumed), and that a high VIX means stocks are cheap and about to rally — "buy the fear" — a claim about direction, which nothing about the VIX's construction guarantees at all.
438 non-overlapping calendar months, 1990-01 to 2026-06: the VIX's own close on the last trading day of month t, paired with the S&P 500's realized volatility and log return over month t+1 — strictly after the VIX reading, so nothing here uses information the VIX didn't have yet. Monthly, non-overlapping sampling avoids the autocorrelated-residual inflation that daily overlapping-window return regressions carry; a Newey–West (HAC) refit is reported alongside every OLS spec as a cross-check, the same robustness pairing this desk used for run 513's century-long trend.
On volatility, the VIX earns its reputation: regressing next month's realized S&P 500 volatility on this month's VIX close returns a slope of +0.93 volatility-points per VIX point (95% CI [+0.77, +1.09], R²=0.51, p=5.2e-29) — the VIX alone explains half the month-to-month variance in what volatility actually does next, and a Newey–West refit lands in nearly the same place (CI [+0.75, +1.11]). A rank correlation that assumes nothing about linearity agrees: Spearman ρ=0.72 (p=2.4e-72).
On direction, it has nothing. The identical design, swapping in next month's return instead of next month's volatility, returns a slope of +0.0236% per VIX point (CI [-0.0653, +0.1125], R²=0.0017, p=0.60) — dead center on zero, both by OLS and by the Newey–West cross-check (p=0.62). Splitting the sample into VIX terciles instead of fitting a line tells the same story from a different angle: the top VIX third averaged +0.81% the following month against +0.60% for the bottom third, a gap of +0.21 points whose 95% CI [-0.83, +1.25] comfortably contains zero (p=0.70). What does move across terciles is the spread, not the average: the standard deviation of next-month return climbs from 2.52 points (low VIX) to 3.82 (mid) to 5.84 (high) — exactly what a volatility gauge should do to a return distribution, and exactly nothing about which way it moves.
Concretely: the four highest month-end VIX readings in the whole 36-year sample split two and two on what followed. October 2008's VIX of 59.9 (the highest on record) was followed by a −7.8% November; four months later, February 2009's VIX of 46.3 was followed by a +8.2% March — the month that turned out to be the bottom of the crash. March 2020's VIX of 53.5, the COVID peak, was followed by a +11.9% April rebound; January 2009's VIX of 44.8 was followed by a −11.6% February. Same instrument, same extreme reading, opposite outcomes each time — the volatility, not the direction, is what the number was built to say.
The VIX is also not even an unbiased predictor of the one thing it does predict well. Averaged across all 438 months, the VIX exceeds the realized volatility that actually follows it by +4.10 points a year (95% CI [+3.47, +4.73], p=5.5e-32) — it ran higher than what followed in 83% of months. This is the volatility risk premium: the compensation investors who sell options collect, on average, for bearing the risk that realized volatility spikes past what the market priced in. It is real, it is persistent across 36 years, and it means "the VIX" and "the volatility that's coming" are not the same number even when the VIX is doing its job.
| Specification | slope | 95% CI | R² | p |
|---|---|---|---|---|
| realized vol, next month ~ VIX (HC3), n=438 | +0.929 | [+0.766, +1.092] | 0.512 | 5.17e-29 |
| realized vol, next month ~ VIX (Newey–West HAC), n=438 | +0.929 | [+0.751, +1.107] | 0.512 | 1.39e-24 |
| S&P 500 return %, next month ~ VIX (HC3), n=438 | +0.0236 | [-0.0653, +0.1125] | 0.0017 | 0.60 |
| S&P 500 return %, next month ~ VIX (Newey–West HAC), n=438 | +0.0236 | [-0.0700, +0.1172] | 0.0017 | 0.62 |
HC3: heteroscedasticity-robust OLS standard errors, this desk's default. Newey–West (HAC, 3 lags): autocorrelation-robust cross-check, reported because monthly volatility is known to cluster. Both agree on both specs.
| VIX tercile (month-end) | n | mean next-month return | SD of next-month return |
|---|---|---|---|
| Low VIX (bottom third) | 146 | +0.60% | 2.52 pts |
| Mid VIX (middle third) | 147 | +0.74% | 3.82 pts |
| High VIX (top third) | 145 | +0.81% | 5.84 pts |
High-minus-low mean gap: +0.21 points, 95% CI [-0.83, +1.25], p=0.70 — contains zero. The standard deviation column, not the mean column, is where the terciles actually separate.
One-sample t-test against zero. VIX read higher than the volatility that actually followed in 83% of the 438 months in this sample.
(Jan 2009's VIX of 44.8, the 5th-highest, was followed by a −11.6% February — included in the prose above, omitted here only for space.) Four of the most extreme fear readings on record; the market crashed further after some, rallied hard after others.
Method. ^VIX and ^GSPC daily closes, Yahoo Finance via yfinance, 1990-01-02 (the start of the CBOE's own historical VIX back-calculation) through 2026-08-20. Resampled to one observation per calendar month: VIXt is the close on the last trading day of month t; realized volatility is the annualized standard deviation (×√252) of daily log returns within a month; the forward return is the summed daily log return within a month. Row t pairs VIXt with realized volatility and return measured over month t+1 only — strictly after VIXt was observable. Months with fewer than 15 trading days (partial first/last month of the sample) are dropped from both ends. All OLS slopes use HC3 heteroscedasticity-robust standard errors; a Newey–West (HAC, 3 lags) refit is reported alongside every spec since realized volatility is known to cluster serially even at monthly resolution. Terciles are formed by VIX level (pandas qcut, roughly equal-sized thirds). The volatility risk premium is a one-sample t-test of VIXt (as a fraction) minus realized-volatilityt+1 against zero.
Limits, stated plainly. n=438 non-overlapping months is a real sample for the volatility spec (R²=0.51 is not going to reverse), but a modest one for detecting a small return effect — this run can say the data finds no relationship between VIX level and next-month return at this sample size, not that no relationship could possibly exist at any horizon or magnitude. Only one horizon (one calendar month) and one instrument (the S&P 500 price index, no dividends) are tested; other studies test the VIX against shorter or longer horizons, or against total-return indices, and could reasonably find something different. This is the VIX's level predicting the next period's return — it does not test whether a change in the VIX, or the VIX relative to its own recent history, carries information, which is a different and more specific claim some traders make. And the volatility risk premium's existence does not by itself explain why it exists; risk compensation for tail exposure is the standard explanation in the options-pricing literature, not something this run's own data can adjudicate.
yfinance library. Retrieved 2026-08-20.
