SMB and HML are the literal, tradeable size and value premiums Fama and French made public in 1993, tracked monthly ever since. Regressing each factor's annual return on the calendar year across all 99 complete years on record: SMB -0.056 pts/yr (95% CI [-0.140, +0.028]), HML -0.050 pts/yr (CI [-0.145, +0.045]) — both contain zero. Splitting flatly at the year the factors went public, both means drop hard in the point estimate and neither drop clears its own bootstrap interval. What doesn't need an interval: a dollar in SMB is worth less today than it was the day before the 1993 cutoff, and the last ten years averaged -2.3%/yr for size and +0.4%/yr for value.

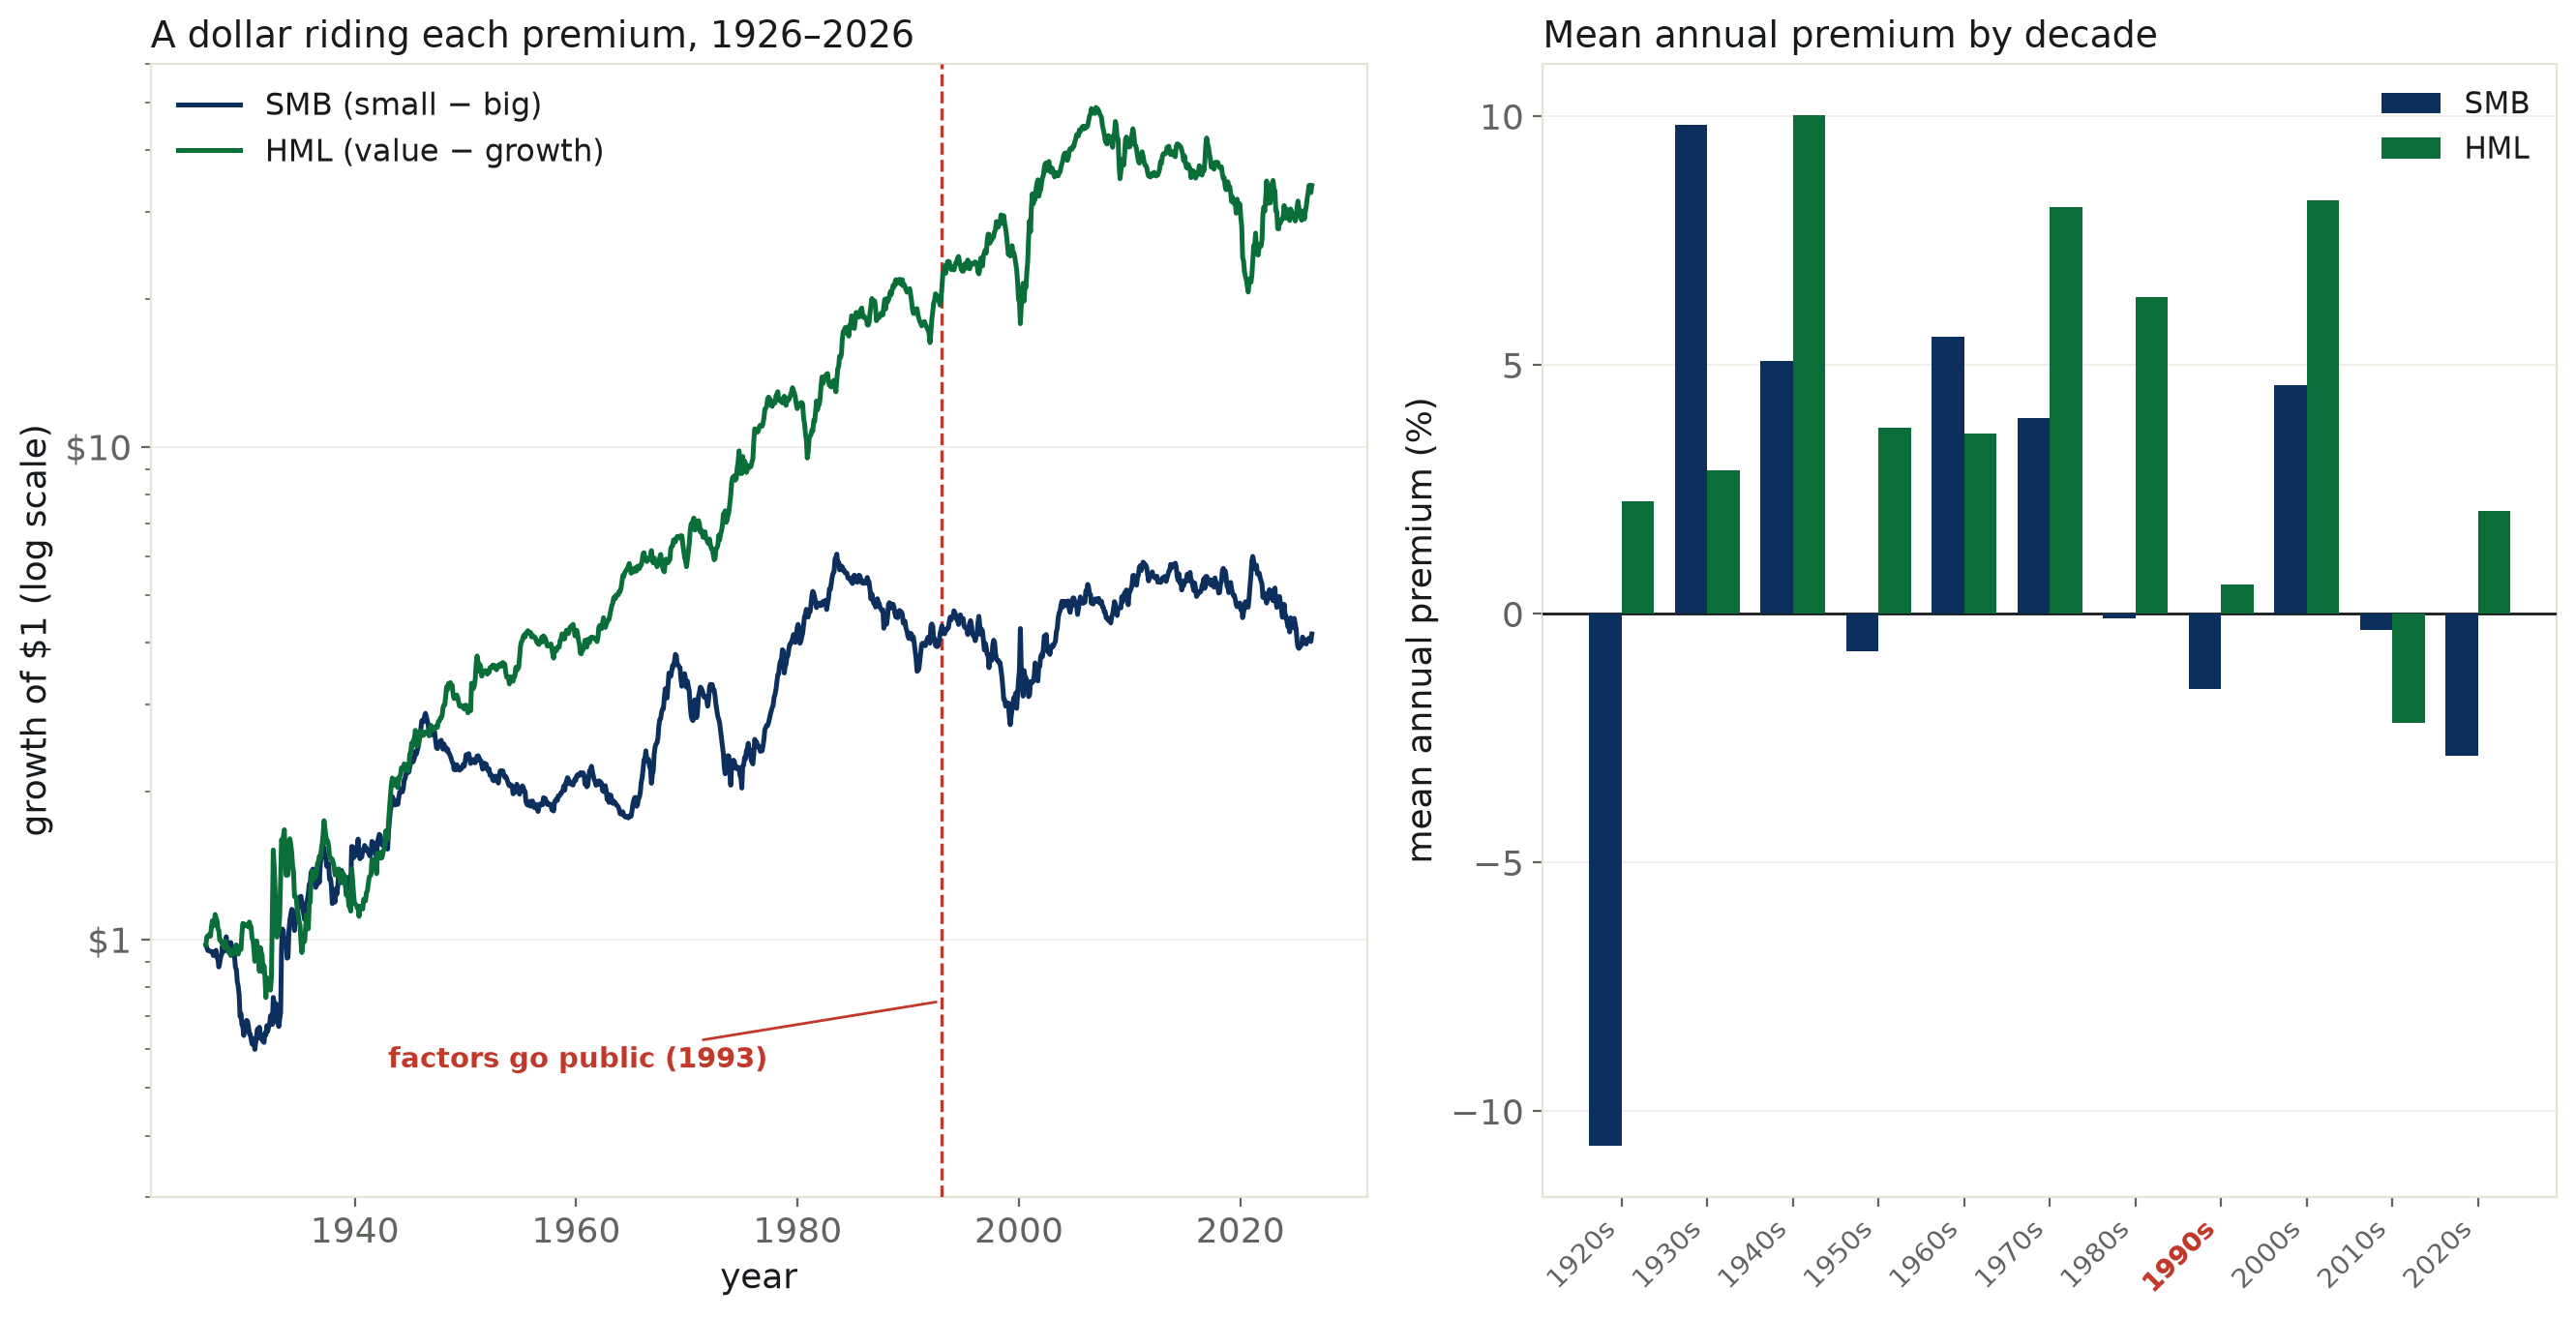
Two claims a reader has heard stated with total confidence: small companies beat big ones, and cheap (“value”) stocks beat expensive (“growth”) ones. Both claims have had their own dedicated, investable, zero-cost portfolio since 1992–93, when Eugene Fama and Kenneth French published SMB (“small minus big”) and HML (“high minus low” book-to-market, i.e. value minus growth) as risk factors and started tracking them monthly, in public, back to 1926. This run pulls that public series — 1,200 months, 1926–2026, 99 complete calendar years — directly from the source and asks the question a century of publicly known factor should be able to answer: is the edge going away now that everyone can read the paper?
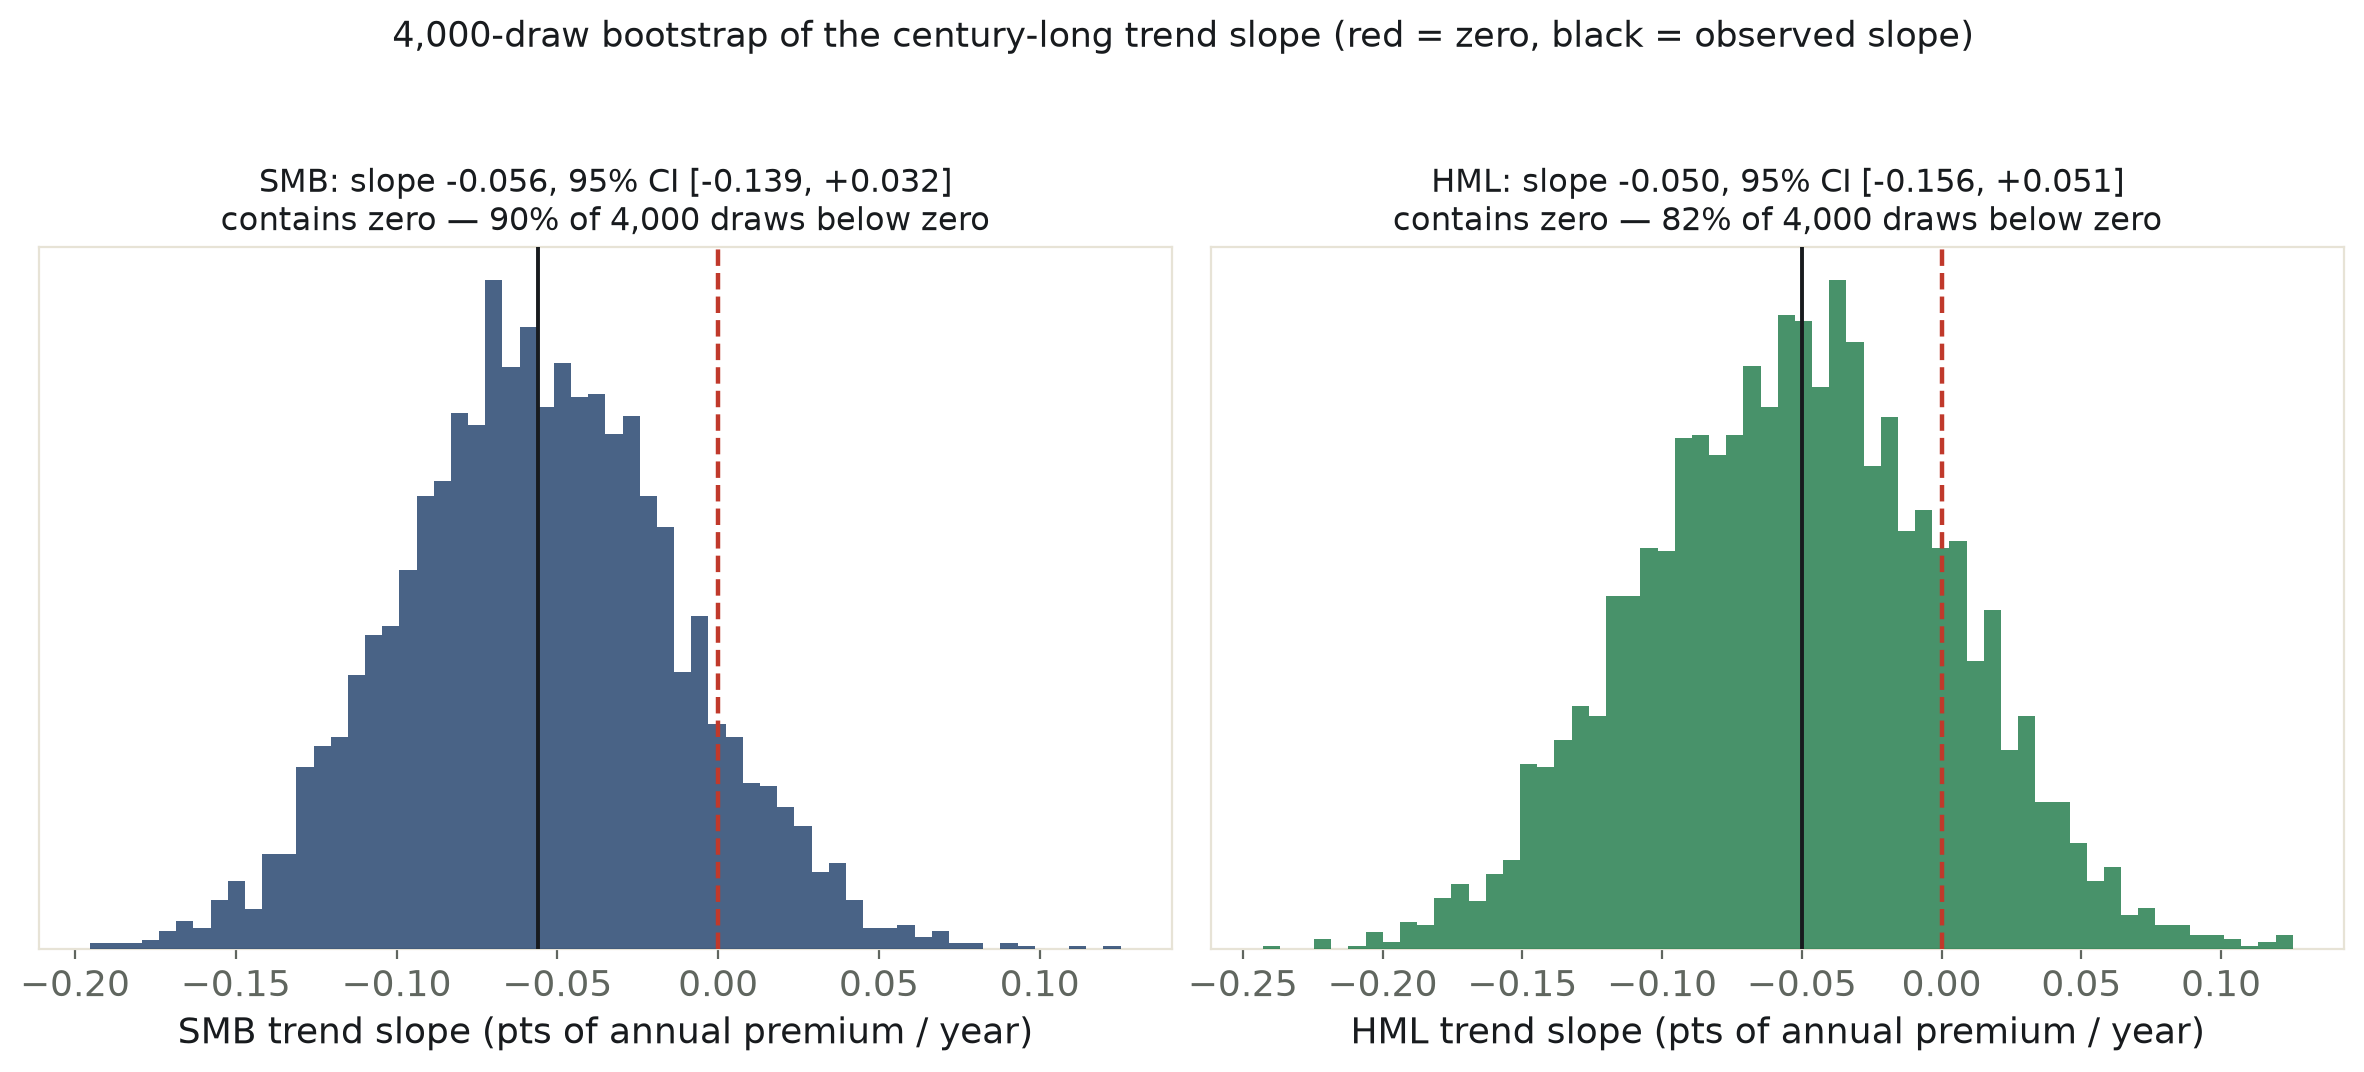
Over the full 99-year span, regressing each factor's annual return on the calendar year, both slopes point down and both confidence intervals contain zero. SMB: -0.056 points of annual premium per year (95% CI [-0.140, +0.028], R²=0.018, p=0.190). HML: -0.050 (CI [-0.145, +0.045], R²=0.011, p=0.300). A monthly-resolution cross-check with Newey–West standard errors (autocorrelation-robust, since monthly factor returns are not independent draws) agrees on both: -0.0036/yr for SMB, -0.0046/yr for HML, neither excluding zero. A century of data cannot detect a straight-line decline in either premium. It also cannot rule one out: a 4,000-draw bootstrap puts 90% of SMB's resampled slopes below zero and 82% of HML's — both real near-misses, not coin flips.
A trend line isn't the only honest way to ask the question. Splitting flatly at 1993 — the year the factors went from an academic finding to a publicly trackable index — the point estimates move a lot: SMB's mean annual premium falls from +3.16% (66 pre-1993 years) to +0.17% (33 years since); HML falls from +5.37% to +2.41%. That looks like exactly the post-publication decay the finance literature has documented in dozens of other anomalies. It is not statistically distinguishable from noise here: a bootstrap on the difference of means gives SMB a 95% CI of [-7.48, +1.20] and HML [-8.82, +3.11] — both contain zero, because 33 post-1993 years is a small, noisy sample for a return series this volatile. The desk reports the point estimate because it is real arithmetic, and reports the interval because the point estimate is not, on its own, a finding.
Two numbers don't need a regression to read. First: did either premium exist at all, across the whole century, ignoring any question of trend? HML's whole-sample mean is +4.38% a year and clears a one-sample t-test against zero comfortably (p=0.0019) — value's premium, averaged over 100 years, is real. SMB's whole-sample mean is +2.16%, and at p=0.079 it does not clear the conventional bar — the size premium, taken as one number across its whole recorded history, was never as solid as its reputation. Second: what actually happened to a dollar. A dollar in SMB was worth $4.26 at the close of 1992, right before the 1993 paper made the factors public, and is worth $4.17 today — 33 years later, and it is worth less than it was the day before everyone found out. A dollar in HML went from $19.91 to $33.93 over the same stretch — still growing, but at a compound annual rate of +1.63% since 1993 against +4.67% before it, roughly a third of its old pace. And the most recent full decade, 2016–2025, needs no statistics at all: SMB averaged -2.32% a year — a full decade in the red — and HML averaged +0.37%, indistinguishable from flat.
| Specification | slope (pts/yr) | 95% CI | R² | p |
|---|---|---|---|---|
| SMB (size), annual, 99 yrs | -0.0561 | [-0.1403, +0.0282] | 0.018 | 0.190 |
| SMB (size), monthly (HAC), 1200 mo, per yr | -0.0036 | [-0.0106, +0.0035] | 0.001 | 0.320 |
| HML (value), annual, 99 yrs | -0.0499 | [-0.1450, +0.0452] | 0.011 | 0.300 |
| HML (value), monthly (HAC), 1200 mo, per yr | -0.0046 | [-0.0140, +0.0049] | 0.001 | 0.340 |
Annual rows: classical OLS SE on compounded calendar-year returns. Monthly rows: Newey–West (HAC, 12 lags) SE on the raw monthly series, slope rescaled ×12 for comparability. Every row contains zero.
Nonparametric case-resample, independent of the OLS normality assumption. Both intervals still contain zero, but both are lopsided — a near-miss, not a coin flip.
| Factor | pre-1993 mean/yr | 1993–2025 mean/yr | Δ | 95% CI on Δ (bootstrap) |
|---|---|---|---|---|
| SMB (size) | +3.16% (66 yrs) | +0.17% (33 yrs) | -3.00 | [-7.48, +1.20] |
| HML (value) | +5.37% (66 yrs) | +2.41% (33 yrs) | -2.96 | [-8.82, +3.11] |
Δ is post-1993 mean minus pre-1993 mean; the bootstrap resamples years within each era 4,000 times. Both point estimates drop by roughly three points a year; both intervals contain zero — 33 post-1993 years is a small, noisy sample for a return series this volatile.
Value's century-long premium clears a conventional bar on its own; size's does not, independent of any question about a trend.
Concrete, not a regression: 33 years after the factors went public, a dollar riding SMB is worth less than it was the day before. HML kept compounding, at roughly a third of its old rate.
Method. SMB and HML are Fama & French's own published factor-return series — long-short, zero-cost portfolios formed monthly by sorting US stocks on market capitalization (SMB) and book-to-market ratio (HML) — downloaded directly from the Ken French Data Library's public CSV release, 1,200 months, July 1926–June 2026. Monthly returns are compounded into calendar-year returns for the primary annual-level trend fit (n=99, the 99 complete Jan–Dec years the series covers); a second fit runs directly on the 1,200 monthly observations with Newey–West heteroskedasticity-and-autocorrelation-consistent standard errors (12 lags), since monthly factor returns are known to carry short-run serial correlation that would otherwise understate the OLS standard error. The 1993 era split follows Fama & French, “Common Risk Factors in the Returns on Stocks and Bonds,” Journal of Financial Economics, 1993 — the paper that took the factors from an academic finding to public, trackable data, the natural cutoff for testing whether a return anomaly decays once traders can read about it (McLean & Pontiff, 2016, document this pattern across dozens of other documented anomalies).
Limits, stated plainly. These are the raw published factor returns: gross of any trading cost, borrowing cost, or management fee an actual small-cap/value fund would charge, all of which eat further into a live investor's realized premium beyond what this page shows. The post-1993 era is 33 years, a small sample for return series with this much year-to-year variance, so the bootstrap intervals here are wide and the desk reports the wide interval rather than the tempting point estimate. This run tests linear trend and a single-year level shift; it does not test a rolling or smoothly time-varying decay, which the literature on this exact question (McLean & Pontiff and its critics) treats as a live and unsettled methodological question in itself. Nothing here identifies a mechanism — capital flowing into factor ETFs, valuation-level effects, or plain sampling variation are all consistent with the same numbers, and this run does not adjudicate between them.
