1,679 confirmed exoplanets with a mass that was independently measured and a radius that was measured from an actual transit — not backfilled from an assumed formula. Rocky worlds and ice/gas worlds both show a real, unambiguous mass-radius relation. Past about a third of Jupiter’s mass, the relation goes flat and tips slightly negative — real in every specification tried, but a near-miss under a bootstrap check, not a clean exclusion of zero.
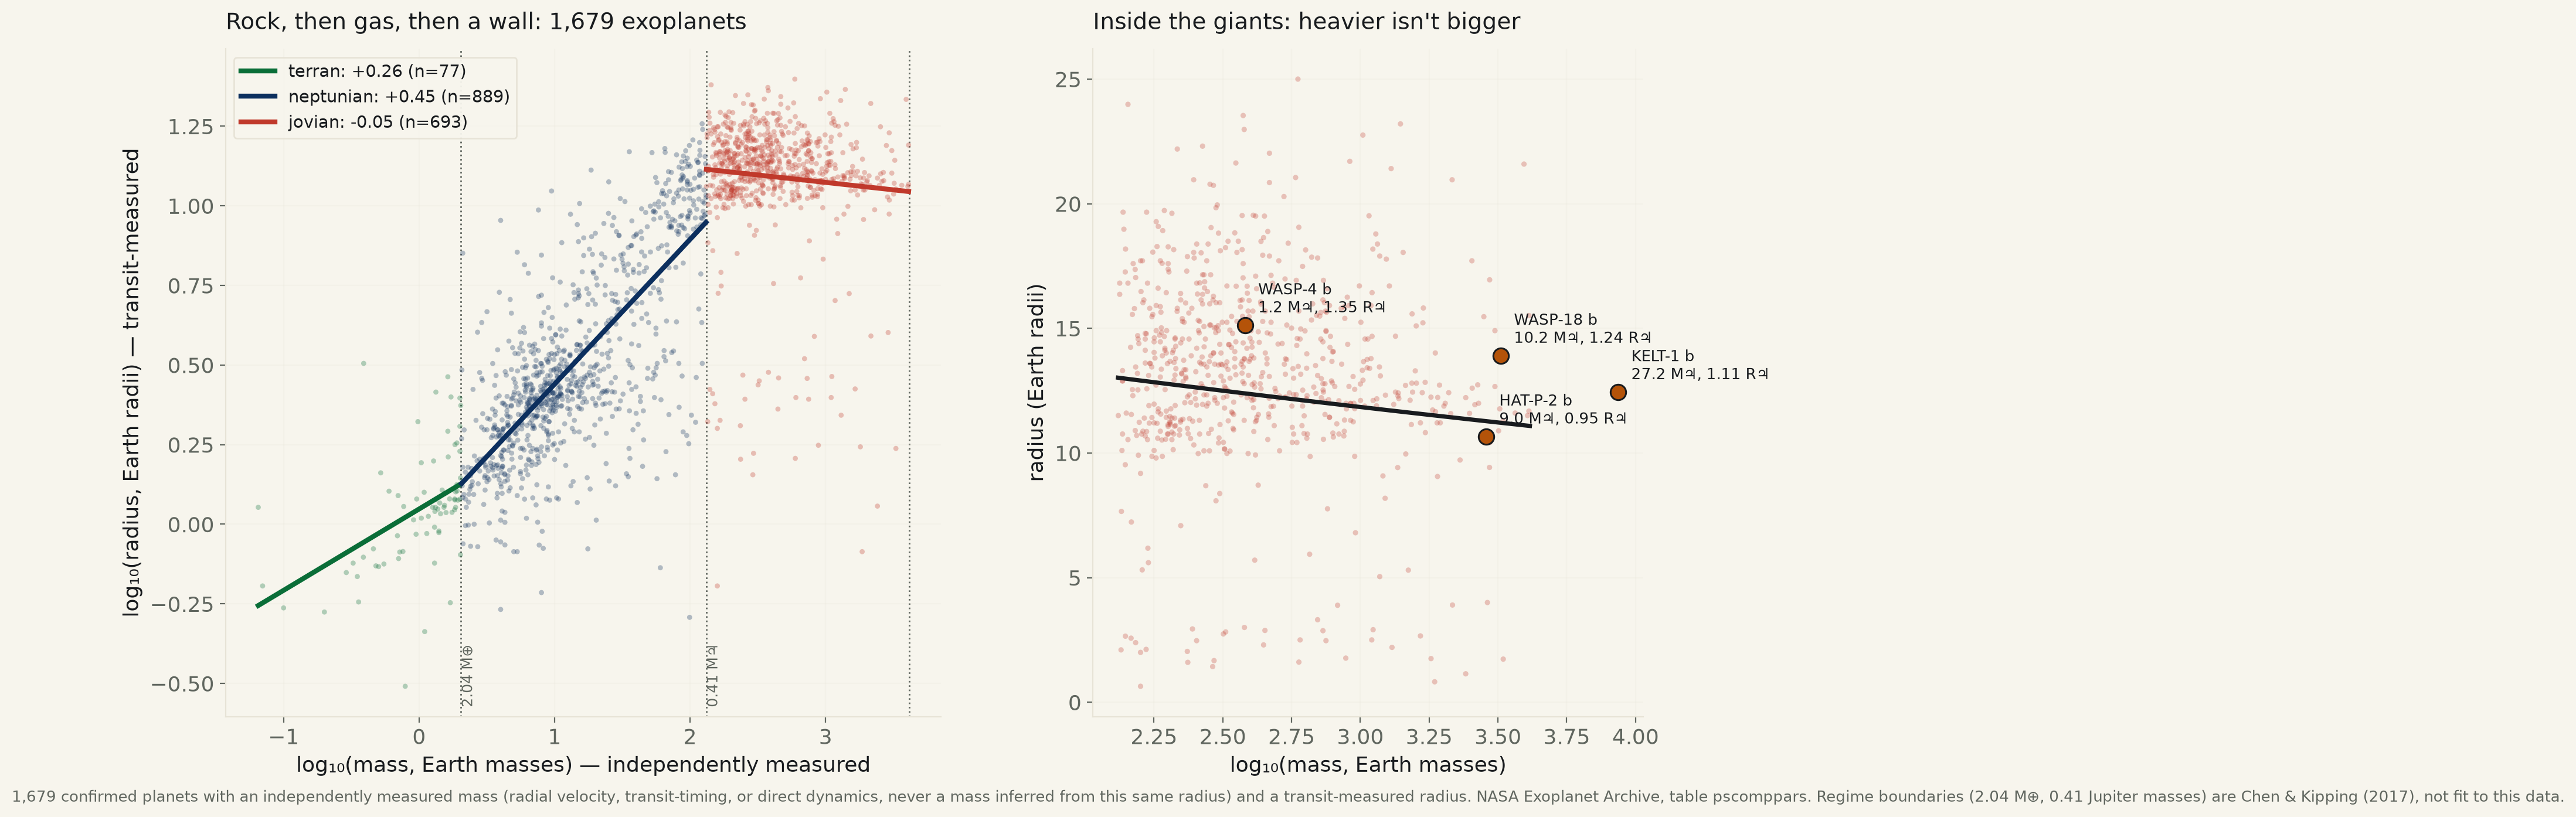
The exoplanet archive now holds 6,262 confirmed planets with both a mass and a radius on file, which looks like exactly the dataset to settle a basic physical question: does a heavier planet have a bigger radius? Before fitting anything, 2,976 of those 6,262 rows (47.5%) have to be thrown out, and the reason is the whole methods section. Their mass wasn’t measured — it was computed by taking the planet’s own radius and running it backward through an assumed mass-radius relation, because no radial-velocity or timing signal was ever detected. Fitting mass against radius on those rows tests whether a formula agrees with itself: R²=0.9685, essentially algebra. The desk's headline numbers use only the 3,286 planets whose mass came from an independent measurement, narrowed further to the 1,679 of those that also transit — the one method that measures radius directly, from the transit depth, rather than backfilling it from a relation of its own.
On that honest set, the full-range fit is real: slope +0.362 in log-log space (95% CI [+0.350, +0.374], R²=0.678, n=1,679). But one slope across the whole mass range hides three different physical regimes, split at boundaries this run didn’t choose — they come from Chen & Kipping (2017) and the IAU’s own working line between planet and brown dwarf. Fit inside each and the story changes shape twice.
Rocky worlds under 2.04 Earth masses: +0.255 (CI [+0.142, +0.369], n=77) — close to the 0.33 a constant-density sphere would produce, and the bootstrap agrees with the parametric fit to three decimals (0% of 4,000 resamples below zero). Add a gas or ice envelope (2.04 to 131.6 Earth masses, roughly Earth to a third of Jupiter) and the slope nearly doubles to +0.455 (CI [+0.426, +0.483], n=889) — a little mass buys a lot of puffiness once there’s a light envelope to inflate. Then, past 0.41 Jupiter masses, the line goes essentially flat and tips slightly negative: -0.0467 (CI [-0.0903, -0.0031], R²=0.0064, p=0.036, n=693). Heavier gas giants are not, on average, bigger gas giants — consistent with electron degeneracy pressure fighting gravity to a draw and then starting to win, the textbook explanation for why Jupiter and Saturn are close to the largest planets physics allows.
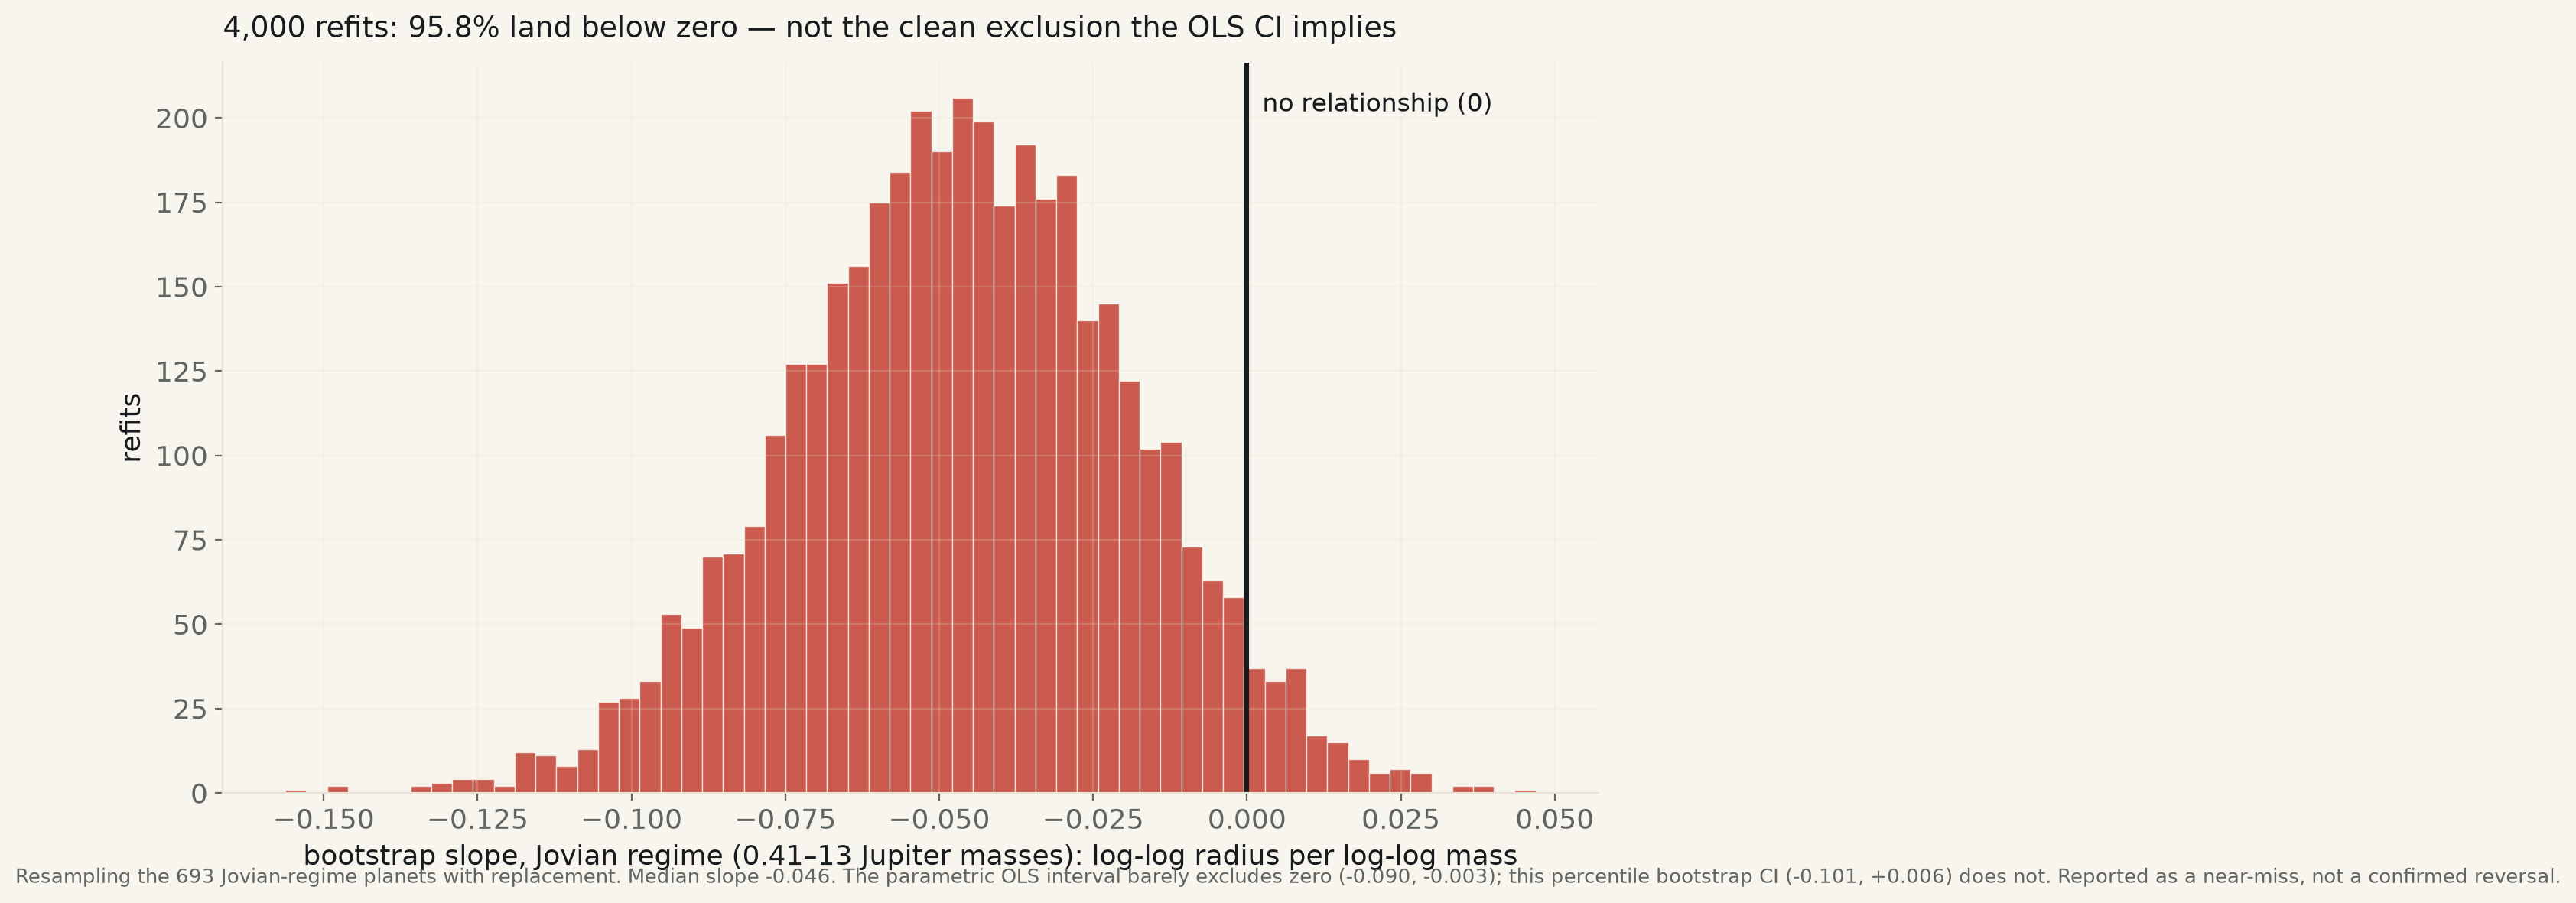
Here is where the desk’s own rule catches its own result. The parametric OLS interval for the Jovian slope barely excludes zero (p=0.036) — the kind of near-miss that is easy to round up to “confirmed.” A case-resampling bootstrap, which doesn’t lean on OLS’s assumptions about the shape of the noise, puts 96.2% of 4,000 refits below zero and returns a 95% percentile interval of [-0.1009, +0.0039] — which touches zero. Splitting the Jovian regime in half tells the same story with less power: +0.0173 (CI [-0.0483, +0.0829], p=0.60) from 0.41 to 3.1 Jupiter masses — a flat null on its own — and -0.1716 (CI [-0.4560, +0.1127], p=0.23, n=108) from 3.1 to 13 — more negative, but underpowered on its own. The honest verdict: the direction is consistent everywhere it’s tested — rocky and ice-giant regimes both clear zero cleanly, and every single specification inside the Jovian regime points negative — but “giant planets shrink as they gain mass” is a near-miss, not a result this run can stand behind at the same confidence as the other two.
Concretely: among 693 planets between 0.41 and 13 Jupiter masses, the median radius near 1 Jupiter mass (91 planets) is 13.65 Earth radii; near 4 Jupiter masses (28 planets), quadruple the mass, it is smaller, at 12.43. Four individually well-measured planets make the same point without needing a median: WASP-4 b (1.2 Jupiter masses, 1.35 Jupiter radii), HAT-P-2 b (9.0 Jupiter masses, 0.95 Jupiter radii — smaller than Jupiter itself), WASP-18 b (10.2 Jupiter masses, 1.24 Jupiter radii), and KELT-1 b — 27.2 Jupiter masses, above the deuterium-burning line and technically a brown dwarf — at 1.11 Jupiter radii. Twenty-three times WASP-4 b’s mass, and a smaller planet. For comparison, nobody needs an archive query for Jupiter and Saturn: Jupiter outweighs Saturn 3.3-to-1 and is only 1.19× the radius.
| Regime | log-log slope | 95% CI (OLS) | R² | n | bootstrap % below zero |
|---|---|---|---|---|---|
| terran (< 2.04 M⊕) | +0.255 | [+0.142, +0.369] | 0.210 | 77 | 0.0% |
| neptunian (2.04–131.6 M⊕) | +0.455 | [+0.426, +0.483] | 0.528 | 889 | 0.0% |
| jovian (0.41–13 M♃) | -0.047 | [-0.090, -0.003] | 0.006 | 693 | 96.2% |
Boundaries (2.04 Earth masses; 0.41 Jupiter masses = 131.6 Earth masses) are Chen & Kipping (2017), not fit to this data. The bootstrap column resamples each regime's own planets 4,000 times with replacement.
| Planet (transit-discovered, independent mass) | Mass (Jupiter masses) | Radius (Jupiter radii) |
|---|---|---|
| WASP-4 b | 1.2 | 1.35 |
| HAT-P-2 b | 9.0 | 0.95 |
| WASP-18 b | 10.2 | 1.24 |
| KELT-1 b | 27.2 | 1.11 |
All four discovered by transit with mass measured independently (radial velocity); error bars on both mass and radius are small relative to the spacing between them. Jupiter itself, for reference: 3.3× Saturn’s mass, 1.19× its radius.
Both contain zero on their own; both point the same direction as the combined Jovian fit. Splitting trades power for granularity — neither half is a stronger claim than the combined regime above.
Method. NASA Exoplanet Archive, table pscomppars (composite parameters, one best-estimate row per confirmed planet), TAP sync endpoint — the same table and endpoint run 030 used for Kepler's third law. Two independence filters, both load-bearing: pl_bmassprov restricted to Mass, Msini, or Msin(i)/sin(i) excludes the 47.5% of rows where the archive itself inferred mass from radius; discoverymethod == Transit further restricts to planets whose radius came from an actual transit depth measurement rather than being backfilled from the same kind of relation in reverse (the archive does not expose a radius-provenance column, so discovery method is the best available proxy — imperfect, since a handful of well-measured transiting radii belong to planets discovered first by radial velocity, such as HD 209458 b, and are excluded here on the conservative side).
Limits, stated plainly. Regime boundaries are taken from the literature (Chen & Kipping 2017; the deuterium-burning limit for the planet/brown-dwarf line), not fit to this sample — a legitimate choice, but a different boundary would shift some planets between regimes. The Jovian-regime result is reported as a near-miss rather than a finding specifically because the bootstrap and parametric intervals disagree; this run does not pick the one that clears zero. n=20 for masses above the deuterium-burning limit is too small to fit and is not used for any claim. No causal mechanism is measured directly here — the electron-degeneracy explanation is the textbook account for this shape, not something this regression demonstrates on its own.
exoplanet_mass_radius.csv · exoplanet_mass_radius_all_incl_circular.csv · fit output (JSON).
