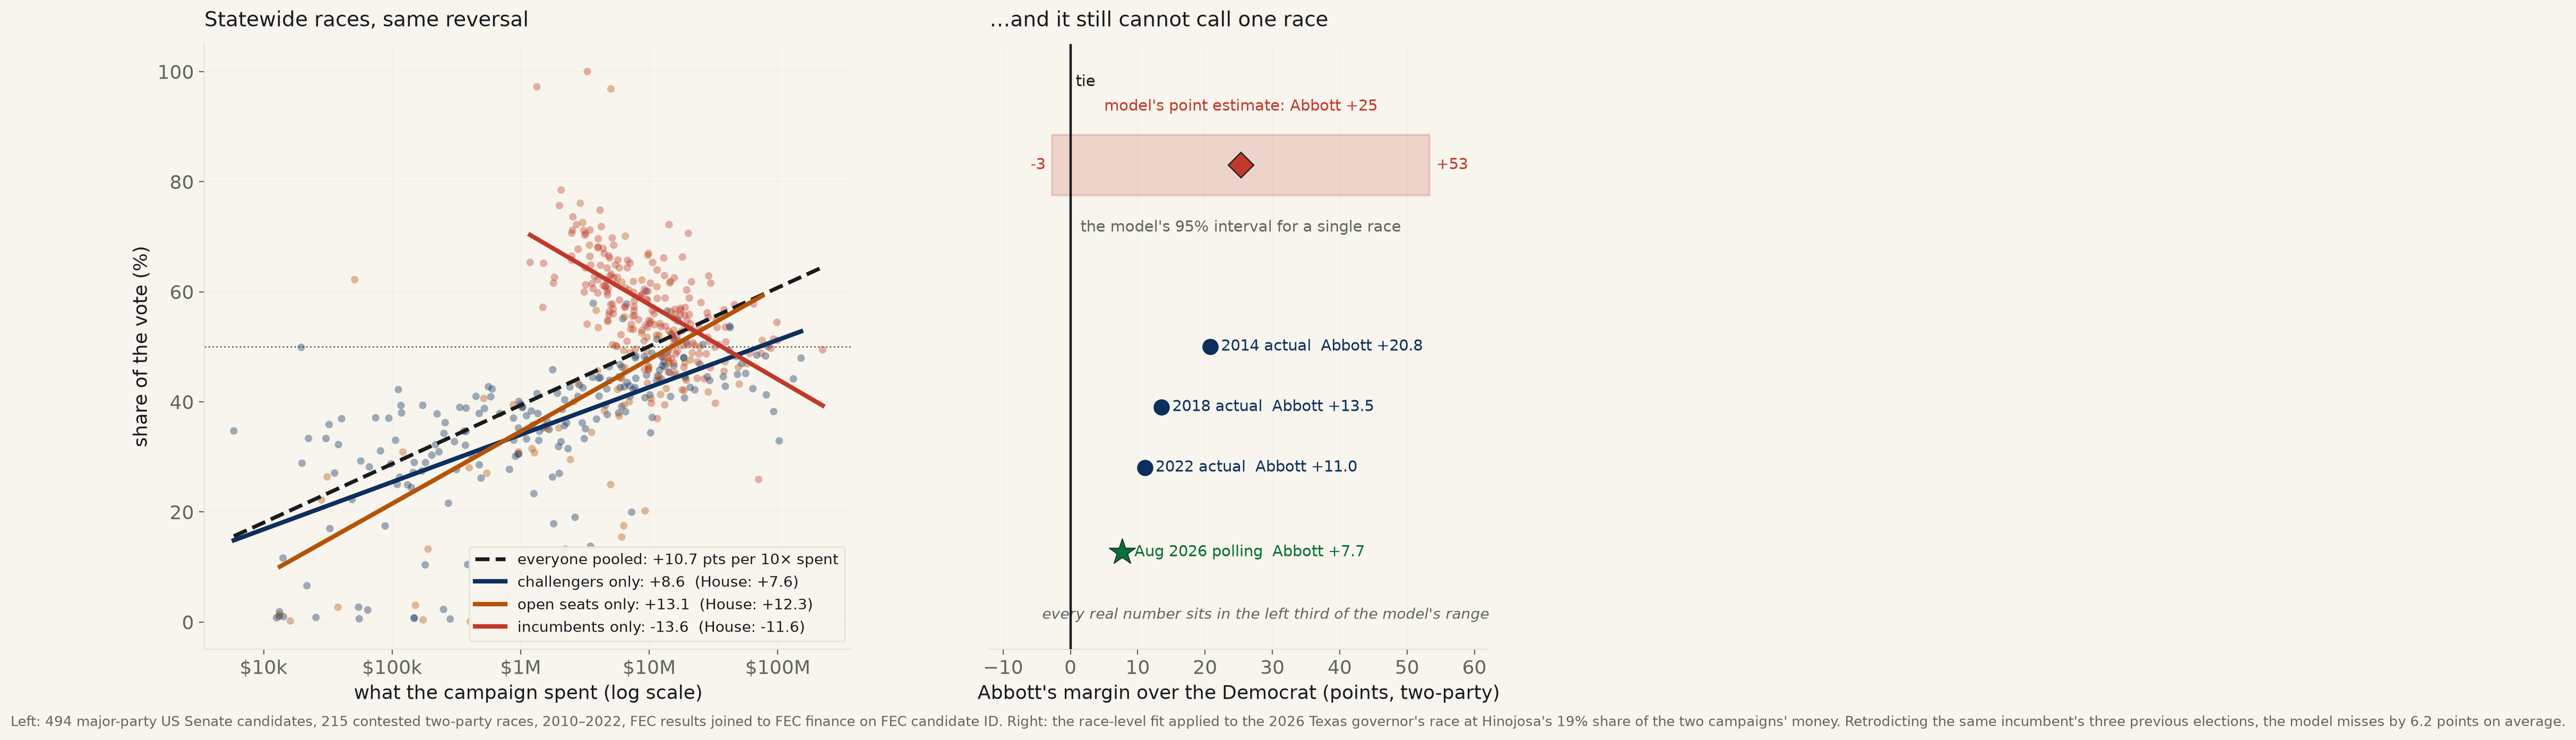
494 major-party US Senate candidates, 215 contested races, 2010–2022. Run 505's House result repeats almost exactly at statewide scale — incumbents -13.62 points per tenfold spent against -11.56 in the House. Money is also less decisive the bigger the electorate. Then the model was aimed at one real race and asked to call it: it misses the same incumbent's last three elections by 6.2 points and returns an interval 56 points wide.
Run 505 found something on +12.21-points-per-tenfold that looked like a slogan confirmed and turned out to be a slogan dismantled: across US House candidates, campaign spending tracks vote share hard, and inside the incumbents the same fit runs backwards. The obvious objection to that result is scale. A House district is small, cheap and low-salience; whatever happens there might be a fact about House districts rather than a fact about money. So the desk refit the whole thing on the closest federal analogue to a statewide office — the US Senate, 494 major-party candidates and 215 contested two-party races over the same seven cycles, joined the same way, on the FEC's own candidate ID.
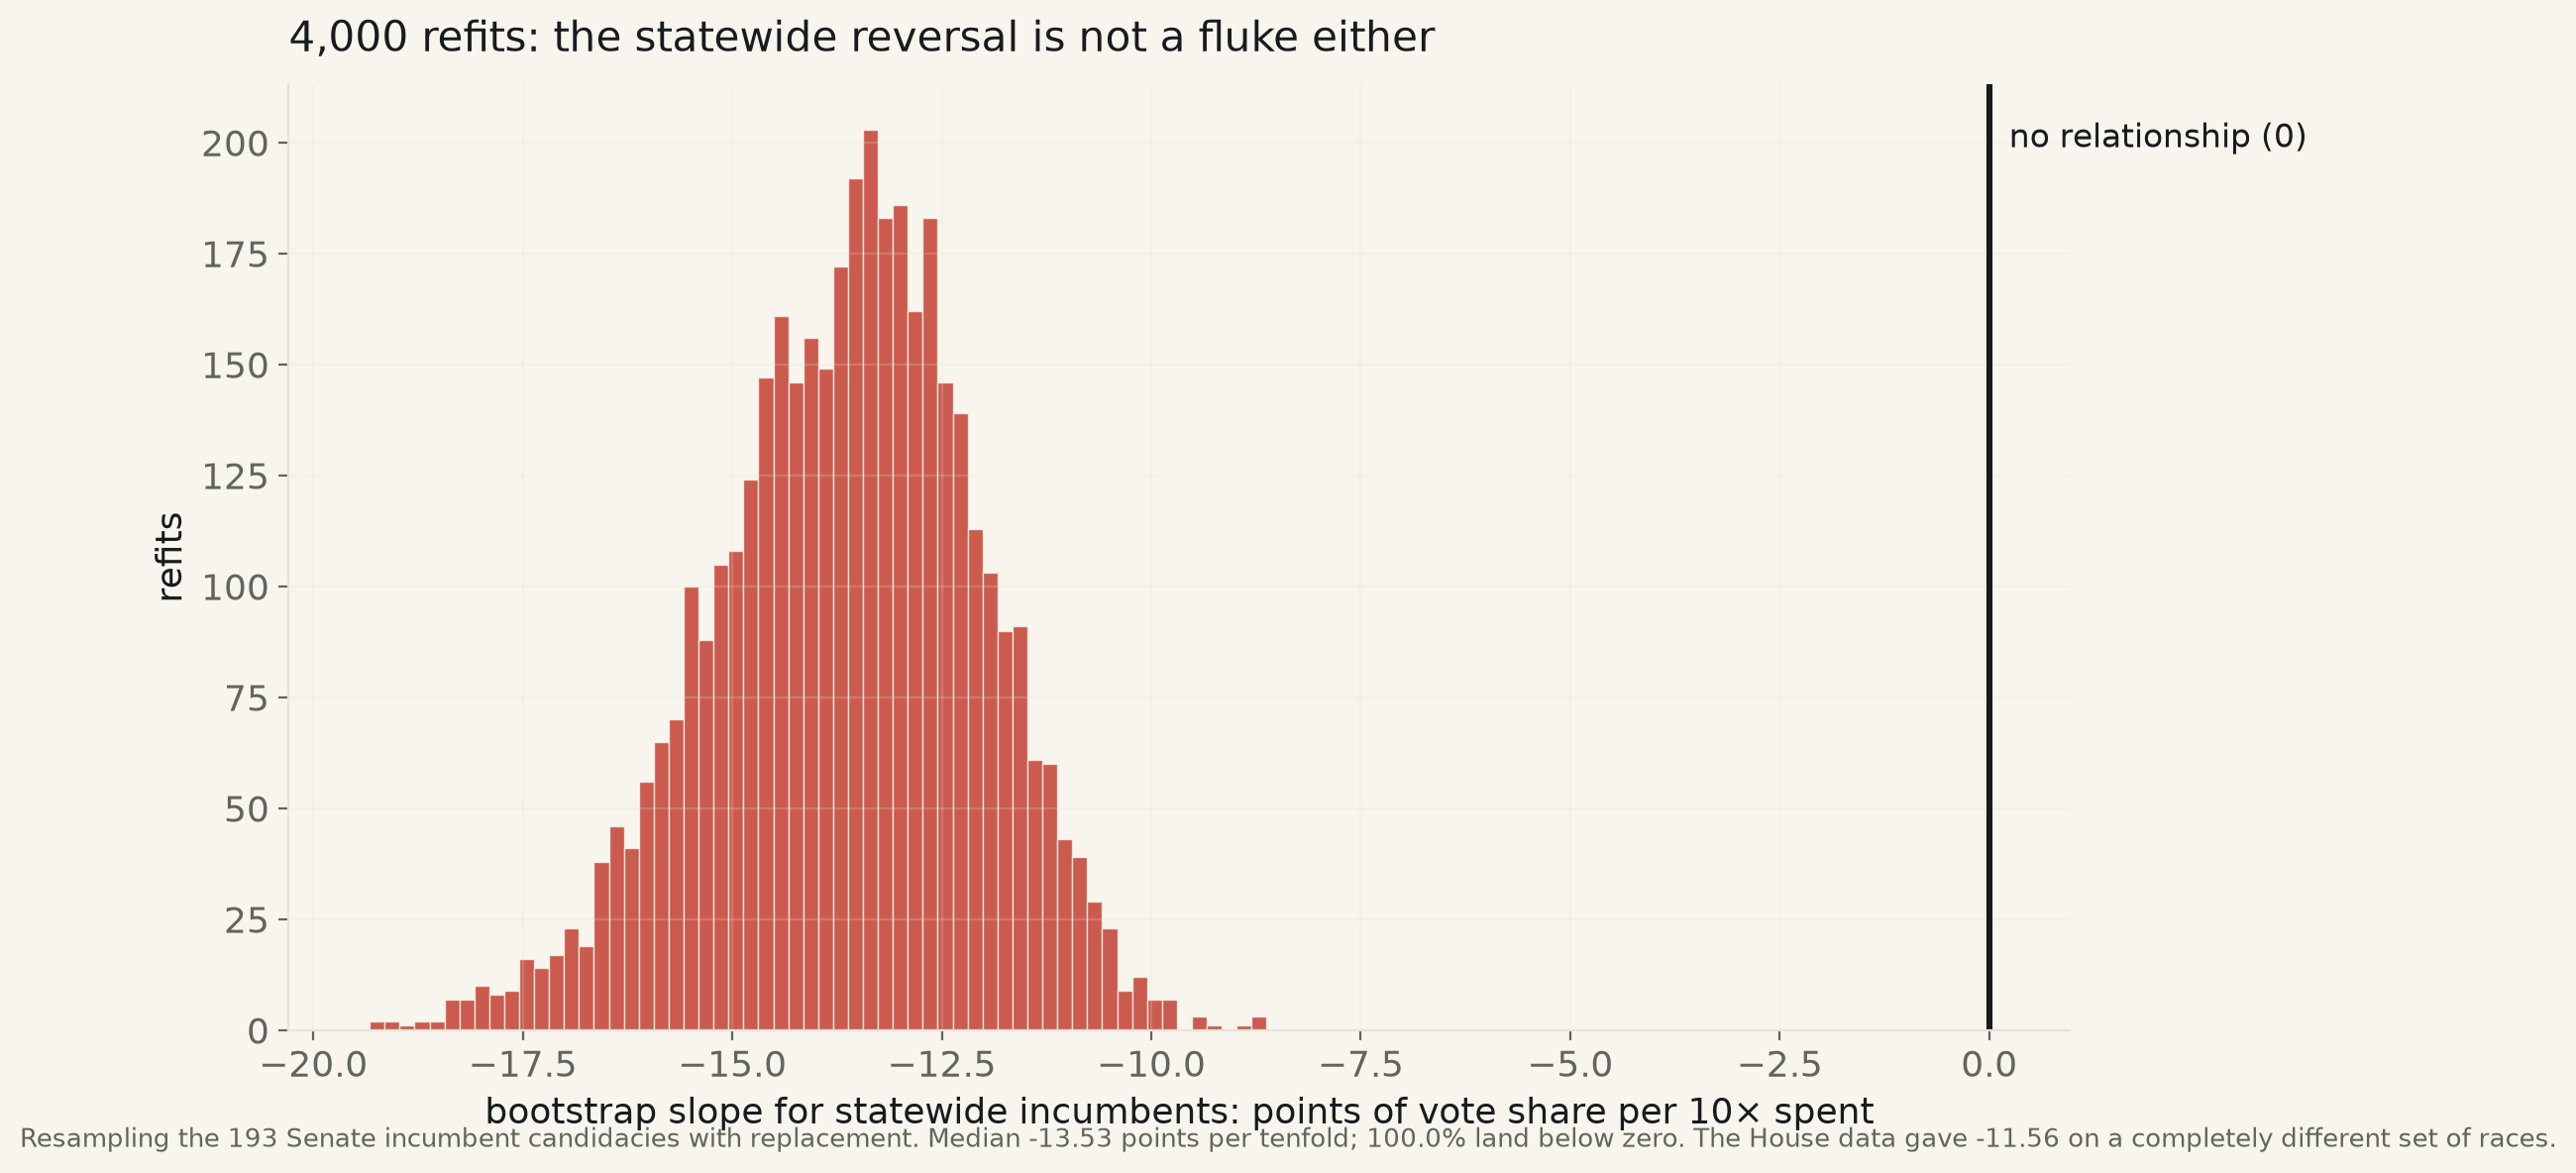
It replicates, line for line. Pooled: +10.67 points of vote share per tenfold spent (95% CI [+9.27, +12.08], R²=0.313). Challengers +8.60; open seats +13.11; and incumbents -13.62 (CI [-16.19, -11.04]) — against -11.56 in the House on an entirely different set of races. Four thousand bootstrap refits of the Senate incumbent slope land below zero 100% of the time. Put both campaigns' spending in one model and both coefficients point down again (-3.91 for the incumbent's own money, -5.22 for the challenger's, n=164). Two independent sets of elections, one answer: heavy incumbent spending marks a seat in danger.
One thing does change with scale, and it changes in the direction that matters. In House races the bigger spender won 89.0% of the time. In Senate races: 77.2%. In House open seats, 83.1%; in Senate open seats, 65.1%. The larger and louder the electorate, the less the money settles — which is roughly what you would expect if the voters of an entire state learn about the candidates from something other than the candidates' own advertising.
Then the part that is worth more than either finding. A fitted model's R² is not evidence it can predict anything; the test is whether it can call something it has not seen. The desk pointed this one at a live election — the 2026 Texas governor's race — and, before letting it near 2026, made it retrodict the same incumbent's three previous elections, whose results are already known.
It misses by 6.2 points on average, in both directions. Greg Abbott's actual margins across those three elections span 11.0 to 20.8 points; a model that misses by six cannot resolve anything inside that range. Asked about 2026 anyway, at the challenger's 19% share of the two campaigns' money, it returns a point estimate of Abbott +25 — higher than any margin he has ever posted — and an honest 95% interval for a single new race of Abbott -3 to +53. That interval is fifty-six points wide. It contains a comfortable Abbott hold, a historic Abbott landslide, and his defeat.
None of that is a forecast of the Texas race and this desk is not offering one; it is a measurement of an instrument, and the instrument reads: not for this purpose. The slope is real, it survived being refit on different elections at a different scale, and it still cannot tell you who wins one contest. Those three sentences are all compatible, and holding them at once is the entire skill. A relationship that is solid across two thousand races and useless for the next one is the ordinary condition of social-science regression, and the reason a number with an interval attached is worth more than a number without one. probability mass ≠ 1.0.
| Who is spending | Senate: pts per 10× | 95% CI | n | House (run 505) |
|---|---|---|---|---|
| everyone pooled | +10.67 | [+9.27, +12.08] | 494 | +12.21 |
| challengers | +8.60 | [+7.27, +9.94] | 203 | +7.62 |
| open seats | +13.11 | [+9.31, +16.92] | 98 | +12.35 |
| incumbents | -13.62 | [-16.19, -11.04] | 193 | -11.56 |
Two disjoint sets of elections, fitted identically. The sign flip inside the incumbents is not a property of House districts.
| Election | Challenger | Actual Democratic share | Model said | Miss (pts) |
|---|---|---|---|---|
| 2014 | Wendy Davis | 39.6% | 45.8% | +6.2 |
| 2018 | Lupe Valdez | 43.2% | 32.8% | -10.5 |
| 2022 | Beto O'Rourke | 44.5% | 42.5% | -1.9 |
Spending shares for these three races are read from contemporaneous press reporting rather than Texas Ethics Commission filings and are approximate; the conclusion does not turn on their precision, because the misses run in both directions and are larger than any plausible error in the inputs. The race-level fit is D vote share = 0.3113 + 0.3261 × D spend share (R²=0.668, n=215).
The point estimate sits above every result Abbott has ever posted, and the interval is wider than the entire range of outcomes Texas gubernatorial elections have produced in the modern era. This is what it looks like when a real relationship is asked a question it cannot answer.
Method. Identical to run 505 and pointed at a different office: the FEC's compiled “Federal Elections” volume for each cycle (US Senate results) joined to the FEC's all-candidates finance file on FEC candidate ID, 2010–2022, 1,244 Senate candidates across 247 seat-cycles. Two structures specific to Senate races are handled explicitly and were caught by a self-check rather than by eye: in fusion states the FEC prints a combined-parties row in addition to each individual party line, and summing all of them double-counts a candidate (New York 2012 came to 144% of the vote); and a state can hold a regular and an unexpired-term election on the same day with the same candidate in both (California 2022), which is why the seat, not the state, is the unit. After both fixes no candidate exceeds a 100% share and all 247 seat-cycles sum to at most 105%.
Limits, stated plainly. Candidate committee disbursements only — no outside, party or independent spending, the same hole run 505 carries. Nothing here identifies causal direction. Standard errors are ordinary least squares, unclustered. The Texas application is the weakest thing on the page and is presented as a demonstration rather than a result: a governor's race is run under state law with no contribution limits in Texas, its money is reported to the Texas Ethics Commission rather than the FEC, and its spending figures here are press-derived. That mismatch is the point — a model fitted on federal statewide races is exactly the sort of thing a reader would reasonably expect to transfer, and the honest finding is how badly it does. The desk offers no forecast of the 2026 Texas governor's race and this run should not be cited as one.
senate_money_votes.csv · senate_two_party_races.csv · fit output (JSON).
