5,405 major-party US House candidates, 7 cycles, 2010–2022. Pooled, the slogan holds: +12.21 points of vote share per tenfold spent, and the bigger spender wins 89.0% of contested races. Split the same data by who is doing the spending and one line reverses — incumbents -11.56 points per tenfold. The money is a smoke alarm, not a fire engine.
“Money buys elections” is said with equal confidence by people who want less of it in politics and people who are raising it. It is a claim about a correlation, so it can be checked. The Federal Election Commission publishes the general-election result for every candidate who appeared on a House ballot, and separately publishes what every candidate’s committee raised and spent, and both files carry the same agency-assigned candidate ID — so the two can be joined exactly, with no name matching and nothing to guess. Seven cycles, 2010–2022, every one of them after Citizens United: 8,534 candidates on a general-election ballot, 5,859 of them major-party, 5,405 of those with a finance filing to read.
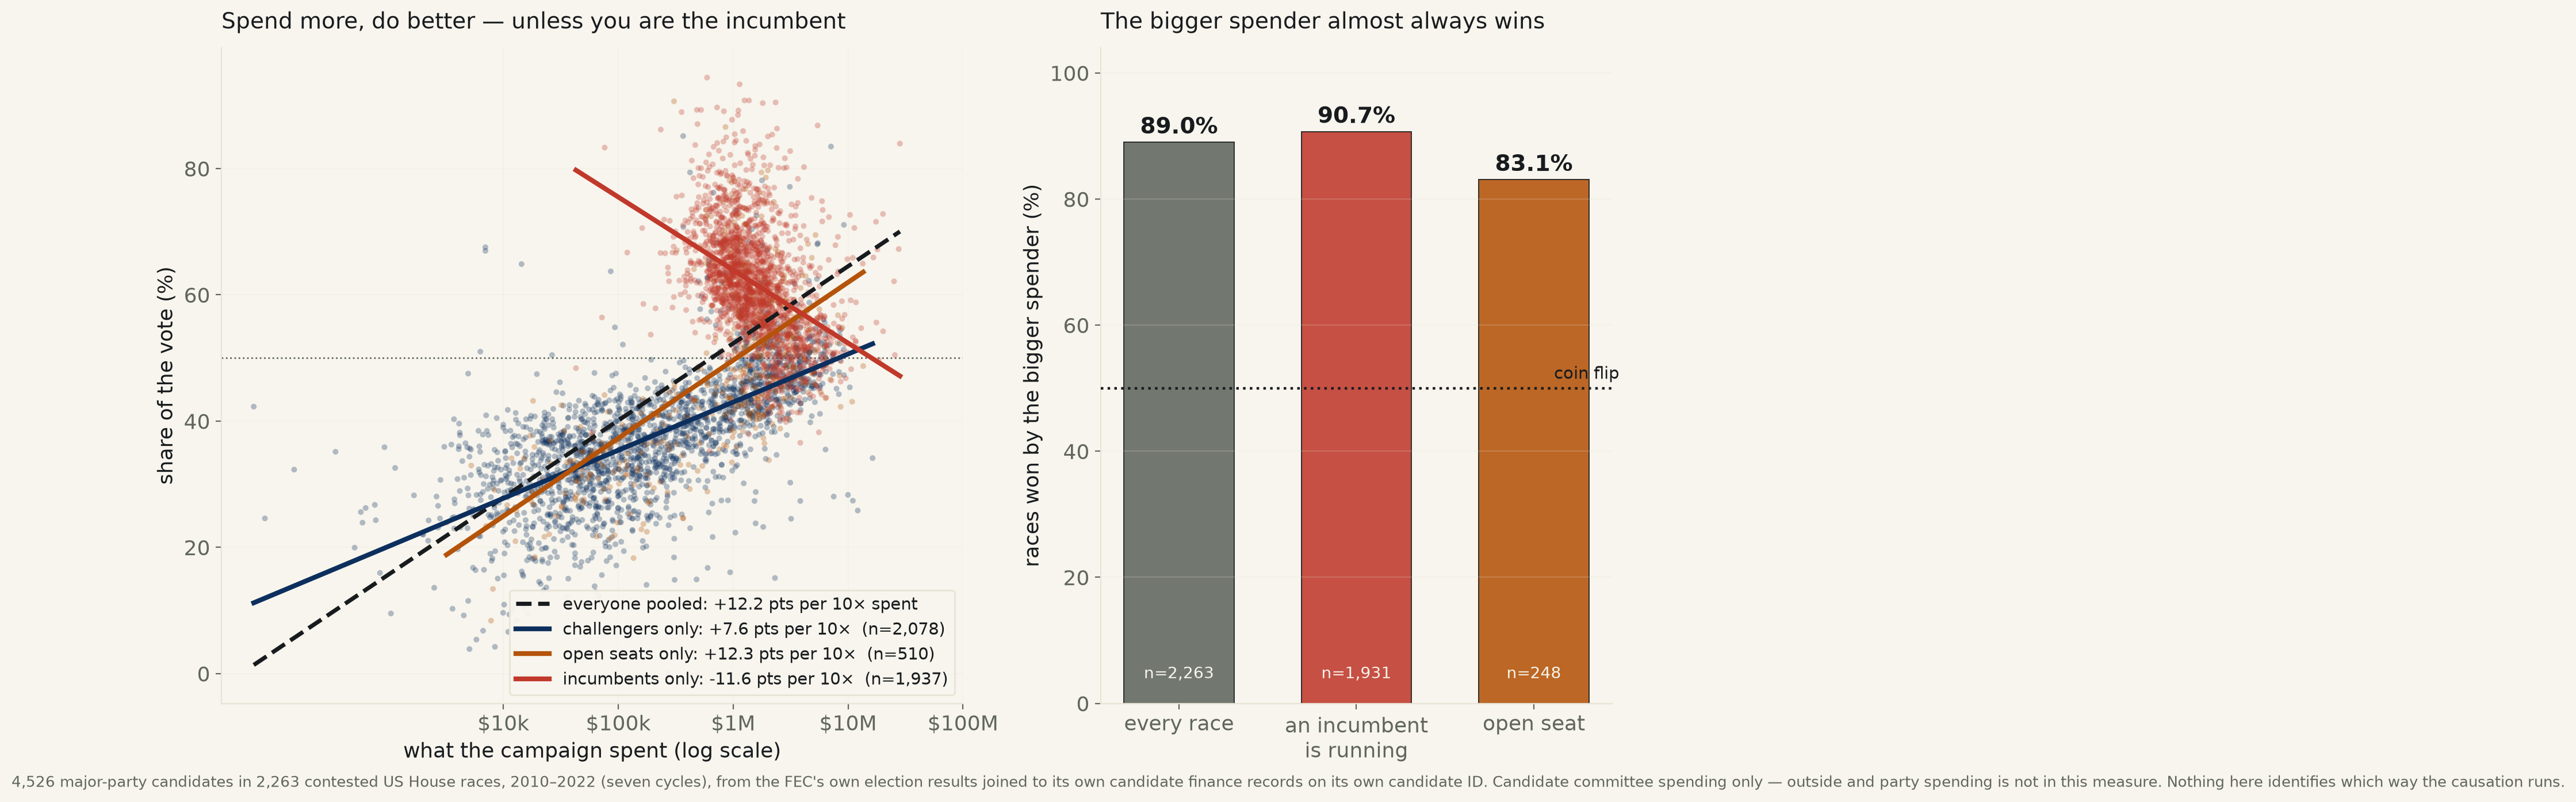
The first pass agrees with the slogan, emphatically. Across contested races, a tenfold increase in what a campaign spends goes with +12.21 points of vote share (95% CI [+11.77, +12.65], R²=0.395, n=4,526). And the blunt version is blunter still: in 2,263 contested two-party races the bigger spender won 89.0% of the time. Nine in ten. On those two numbers the case looks closed.
Then you ask who the spenders are. Run the identical fit inside each group rather than across all of them, and one of the three lines points the other way: challengers gain +7.62 points per tenfold (CI [+7.23, +8.00]), open-seat candidates +12.35 (CI [+11.02, +13.68]), and incumbents -11.56 (CI [-12.71, -10.41], n=1,937). An incumbent who spends ten times as much does about twelve points worse. The pooled slope was never really measuring what money does to a campaign; it was mostly measuring the difference between incumbents, who raise a median of $1,438,836 and usually win, and challengers, who raise $179,987 and usually lose.
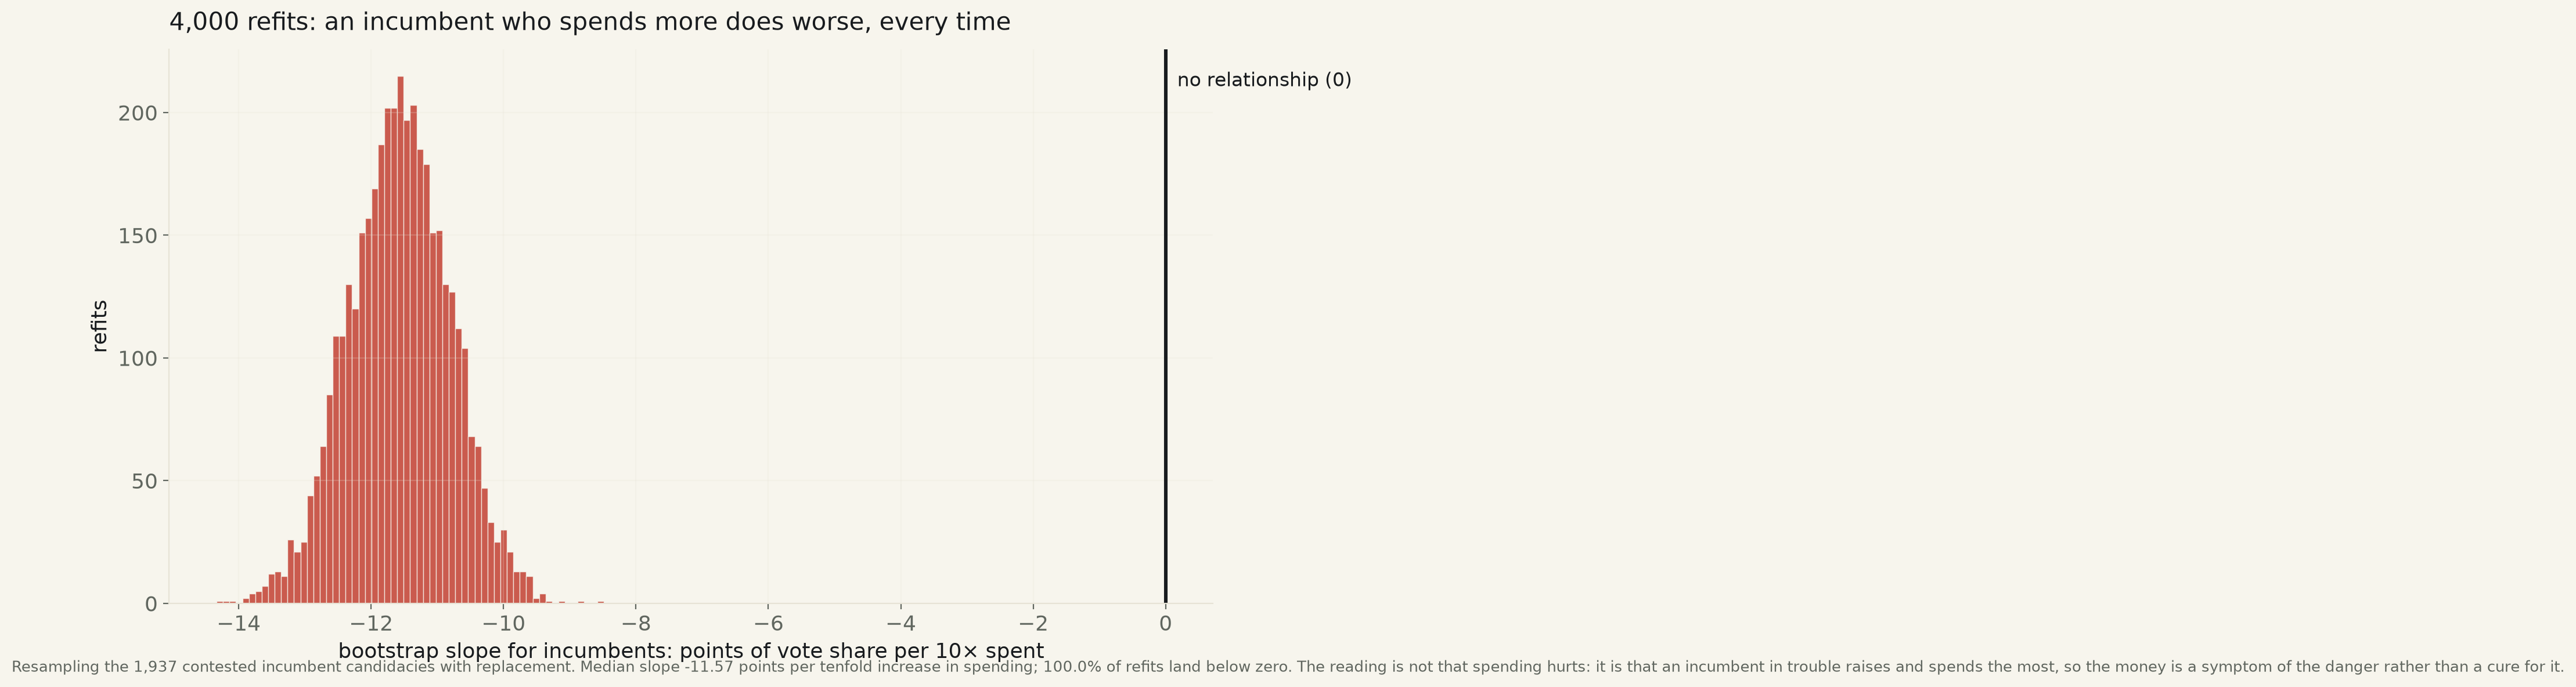
The obvious objection is that unopposed incumbents spend nothing and take the whole vote, which would manufacture that negative slope out of bookkeeping. It does not: every figure above is already restricted to contested races with both major parties on the ballot and both filing with the FEC. Keeping the unopposed in makes the reversal stronger (-14.71), not weaker, so the conservative number is the one printed. Four thousand bootstrap refits of the incumbent slope land below zero 100% of the time, with a median of -11.57.
Put both campaigns’ spending in one model and the shape resolves. Regressing an incumbent’s vote share on what the incumbent spent and what the challenger spent together: the challenger’s money is worth -6.47 points to the incumbent per tenfold (CI [-6.90, -6.04]), and the incumbent’s own money is worth -2.98 (CI [-4.12, -1.83]) — R²=0.454 on 1,886 incumbent-contested races. Both point down. The reading is not that a war chest is harmful. It is that a safe incumbent does not need one and does not build one, and an incumbent who is about to lose can see it coming a year out and raises accordingly. The money arrives because the seat is in danger. It is a smoke alarm, and this desk has just measured how loudly smoke alarms correlate with fires.
Which leaves the honest limit, and it is the whole question. Nothing here establishes direction. Spending tracks how close a race is, and closeness is exactly what makes people spend. The one cut that comes nearest to a clean comparison — open seats, where no incumbency advantage is in the way — is also the cut where the bigger spender wins least often: 83.1%, against 90.7% where an incumbent is running. The nine-in-ten statistic is, to a first approximation, a statistic about incumbency wearing a dollar sign. One more thing this run cannot see: it counts what the candidates’ own committees spent, and not a cent of the outside and party money that has run alongside every one of these seven cycles.
| Who is spending | Points of vote share per 10× spent | 95% CI | R² | n | Median spend |
|---|---|---|---|---|---|
| incumbent | -11.56 | [-12.71, -10.41] | 0.167 | 1,937 | $1,438,836 |
| challenger | +7.62 | [+7.23, +8.00] | 0.420 | 2,078 | $179,987 |
| open seat | +12.35 | [+11.02, +13.68] | 0.396 | 510 | $1,213,680 |
| everyone pooled | +12.21 | [+11.77, +12.65] | 0.395 | 4,526 | — |
Every row is contested races only: both major parties on the ballot, both with an FEC filing. The pooled row is the number the slogan rests on; the three above it are the same arithmetic applied to candidates who are actually comparable to one another. Including unopposed candidates moves the incumbent slope to -14.71 and the pooled slope to +13.35 — the reversal gets larger, so the smaller version is the one reported.
A within-race measure cannot be confounded by anything that varies between districts, because both numbers come from the same contest. It is still not a causal estimate: the candidate expected to win attracts the money, and the money arrives before the votes are counted, which is the same order of events either explanation predicts.
| Race type | Won by the bigger spender | Races |
|---|---|---|
| every contested race | 89.0% | 2,263 |
| an incumbent is on the ballot | 90.7% | 1,931 |
| open seat, no incumbent | 83.1% | 248 |
The cut with the weakest incumbency confound is the cut where money looks least decisive.
Method. Votes come from the FEC's compiled “Federal Elections” volume for each cycle, US House results sheet — every candidate on a general-election ballot, their general-election votes and share, their party, and the agency's own incumbent marker. Money comes from the FEC's “all candidates” bulk file for the same cycle: total disbursements by the candidate's own committee, plus the agency's incumbent / challenger / open-seat code. The two are joined on FEC candidate ID, an exact identifier, never on names. The agency renamed the results sheet and several of its columns over the period and misspelled “Results” in 2012, so both are matched by pattern, and every cycle's parse is checked before use: 8,534 ballot candidates carried through, 5,859 major-party, of whom 5,405 filed with the FEC at all. Candidates who never crossed the reporting threshold have no filing to read and are excluded and counted rather than treated as spending zero.
Limits, stated plainly. This measures candidate committee disbursements. It does not measure outside spending, party committee spending, or independent expenditures — which across these seven post-Citizens United cycles are a large and unevenly distributed part of the money in a competitive House race, and their omission is the biggest hole in the run. Every fit here is a correlation between two things a campaign produces at the same time; none of it identifies direction, and the strongest single reason to doubt a causal reading is on the page — the coefficient on an incumbent's own spending is negative, which no theory of money buying votes predicts and which the alternative explanation predicts exactly. Standard errors are ordinary least squares and are not clustered by district or by cycle, so the intervals are narrower than a fully specified panel model would give. Seven cycles is not the whole post-Citizens United era: the FEC had not published a compiled 2024 results volume when this ran, so 2024 is absent, and 2010 is the first cycle available in this format.
house_money_votes.csv · house_two_party_races.csv · fit output (JSON).
