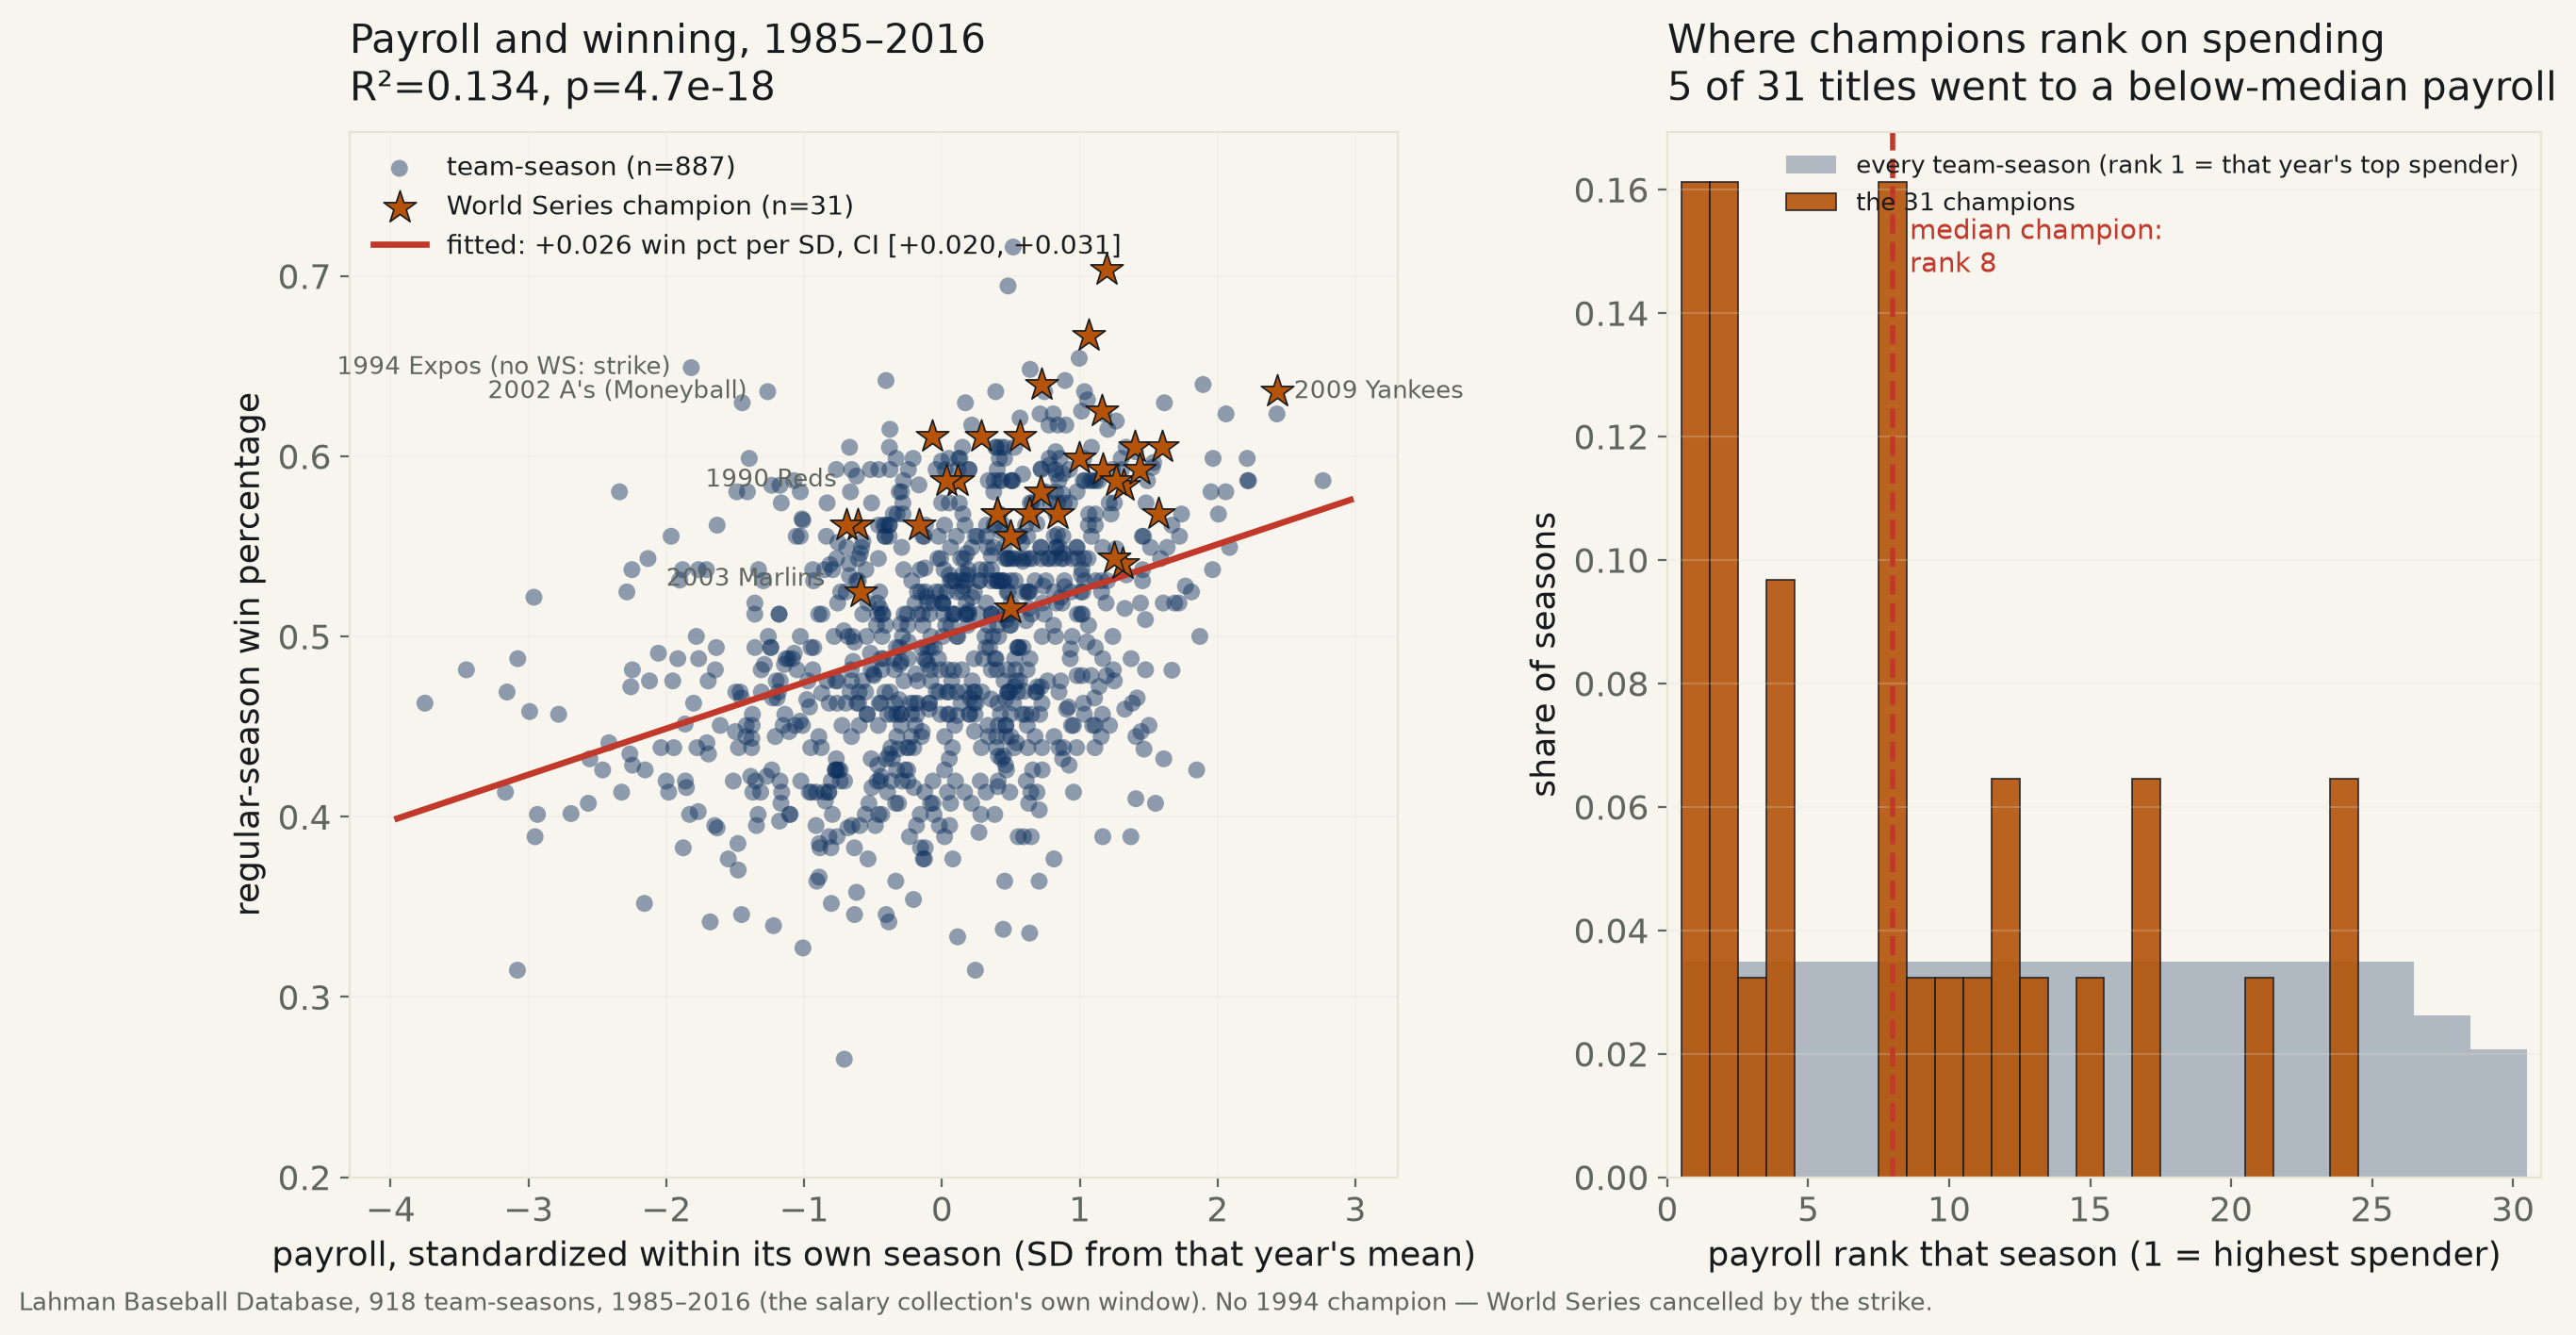
918 MLB team-seasons, 1985–2016. Payroll, standardized against its own season, predicts win percentage — modestly, R²=0.13. It predicts a World Series title more clearly: 2.67× the odds per standard deviation of payroll (CI excludes 1). The median champion ranked 8th in spending that year. 5 of 31 titles went to a below-median payroll anyway.
“Just buy a better roster” is the standard explanation for why one franchise wins and another loses, offered equally by fans of the team that spent and fans of the team it beat. It is testable directly: the Lahman Baseball Database has published every player's salary since 1985 and every team's regular-season and postseason record back to 1871. Summed to the team level and matched to Teams' own championship flag, that is 918 team-seasons, 1985–2016 — the exact span the salary collection covers, and it stops there; the database does not extend salaries past 2016.
Compare raw payroll to raw win percentage and the fit is real but small: slope +0.032, R²=0.029. That number is not quite honest, because it is measuring two things at once — how much a team spent, and what year it is. A $60M payroll was near the top of the league in 1990 and near the bottom in 2010; comparing dollar figures across three decades of salary inflation without adjusting for it stacks the confound directly onto the slope. The fair version standardizes each team's payroll against its own season's mean before fitting anything, and gives every franchise's repeated appearances one cluster-robust standard error rather than 918 independent ones. That fit: +0.026 win percentage per standard deviation of within-year payroll, 95% CI [+0.020, +0.031], R²=0.134, p=4.7e-18 — excludes zero clearly, and explains a real but modest 13% of the variance in how a team's season goes. The other 87% is roster construction, health, and luck.
Wins are the softer half of the claim. Titles are the one people actually mean. Making the playoffs at all: a team one standard deviation above its season's average payroll has 2.20× the odds (95% CI [1.73, 2.80], p=1.4e-10). Winning the World Series specifically: 2.67× the odds per standard deviation (95% CI [1.87, 3.80], p=5.7e-08) — excludes 1, same as the wins fit, on 31 champions in the window. The median champion ranked 8th in payroll that season, against a league-wide median rank of 15 — a title, typically, requires being in the top third of spenders, not the top spender.
Typically, not always. 5 of 31 champions in this window won from a below-median payroll — the table below names all five. The most-cited of them, the 2003 Marlins, ranked 24th of 30 in payroll the year they beat the 101-win Yankees. Two of the five happened before the league even reached 28 teams. The exceptions are real; they are also a sixth of the sample, not half of it.
The relationship also did not fade. MLB introduced a luxury tax on high payrolls starting with the 2003 season, explicitly to blunt exactly this effect. Split the fair fit at that line and the slope, if anything, is steeper afterward: +0.023 (CI [+0.016, +0.030], R²=0.107) pre-2003 versus +0.029 (CI [+0.021, +0.037], R²=0.169) from 2003 on. Both intervals clear zero on their own; neither era shows the tax working as a leveler, at least not on this measure.
Two anecdotes the fit predicts and the standings confirm. The 1997 Marlins won the World Series on a top-five payroll, then were dismantled by ownership the following winter — the 1998 Marlins, same roster mostly sold off, posted the fourth-worst residual in the whole dataset, a payroll near league average and a 54-108 record. And the 1994 Montreal Expos, the best record in baseball that year on one of the league's smallest payrolls, never got to test any of this: the World Series was cancelled by the players' strike before October arrived, the one true wildcard this dataset cannot resolve either way.
| Year | Champion | Payroll rank that season | Field size |
|---|---|---|---|
| 1985 | Kansas City Royals | 17 | 26 |
| 1987 | Minnesota Twins | 24 | 26 |
| 1990 | Cincinnati Reds | 21 | 26 |
| 2003 | Florida Marlins | 24 | 30 |
| 2015 | Kansas City Royals | 17 | 30 |
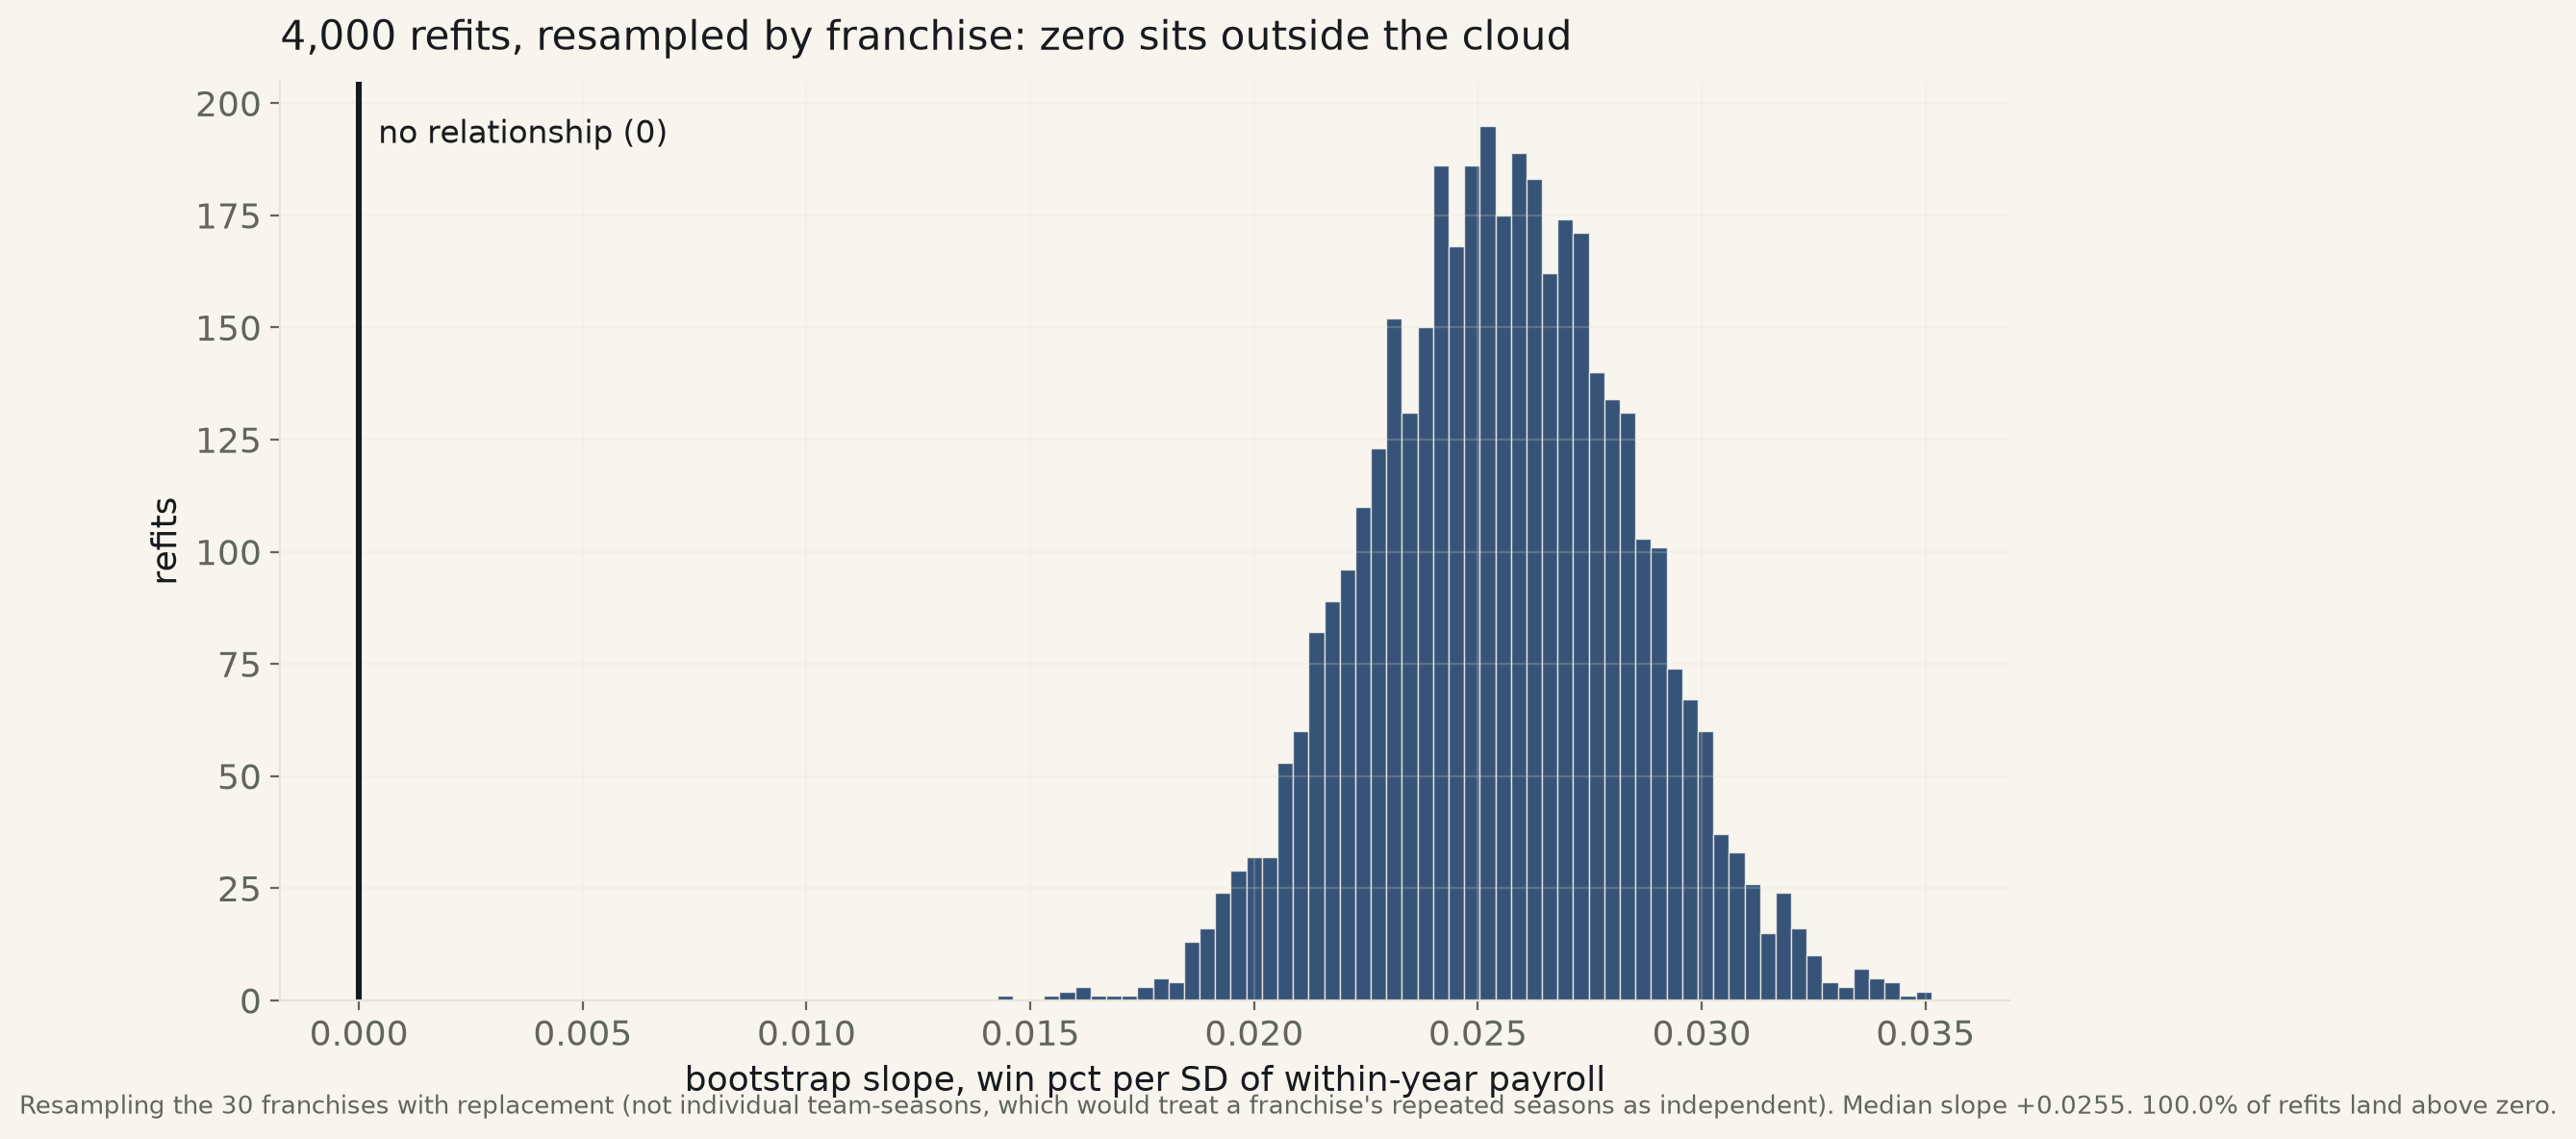
Method. Payroll is the sum of every player's salary credited to a team in a given season, from the Lahman Baseball Database's Salaries table (sourced from USA Today's annual Opening Day payroll survey and mid-season updates). Win percentage, postseason appearance, and World Series championship come from Lahman's own Teams table (DivWin/WCWin/LgWin/WSWin flags), not a separate bracket reconstruction. Because nominal payroll roughly quintupled over this window from salary inflation alone, every fit here uses payroll standardized within its own season (z-score of log payroll) rather than raw dollars, so a team is only ever compared to its actual competition that year. Standard errors are clustered by franchise, since the same 26-30 organizations reappear up to 32 times each and their seasons are not independent draws.
Limits, stated plainly. The salary collection stops at 2016 by construction — this is not this desk's choice, it is where the source data ends, so the past decade of MLB spending (the current $700M+ Dodgers-tier payrolls) is entirely absent. Thirty-one championships is the real sample size for the title question, and the logistic CI reflects that: it is wide. Payroll is Opening Day plus in-season additions, not adjusted for how many of those dollars were paid to players who were hurt, traded away, or released — a real payroll can buy a bad team. And this is regular-season strength translated into a single-elimination postseason bracket best-of-seven at every round: even a team that is genuinely and durably better wins any given short series well under 100% of the time, which is a second, honest source of the scatter in the championship fit beyond payroll noise.
