24,768 S&P 500 trading days, 1928-01-03–2026-08-11, classified by the Senate's own record of every session's start and end date. Raw daily return runs +0.031% in session vs +0.037% out — the popular claim's own direction — but six separate tests of that gap, from a plain t-test to a within-year fixed-effects model to collapsing to the 163 true independent spells, all return a 95% CI that contains zero. A dollar-growth chart that looks like a landslide the other way is an illusion built from unequal compounding periods, not a second finding.

"The market only goes up when Congress goes home" is a real claim in the finance literature (Ferguson & Witte, and others, going back to a 2003 working paper), not just a saying — the idea being that a legislature in session is a legislature that might regulate, tax, or otherwise disturb something, so equities do better when it can't. It is also, unusually for this desk, a claim built entirely from public record: the Senate publishes the convening and sine-die-adjournment date of every session of every Congress back to the 1st (1789), and Yahoo Finance carries a daily S&P 500 close back to December 1927. Every one of 24,768 trading days, 1928-01-03 to 2026-08-11, is classified in-session or out by whether it falls inside one of the Senate's own recorded session spans (310 recorded sessions, merged to 288 non-overlapping spans where a special session sat inside a regular one).
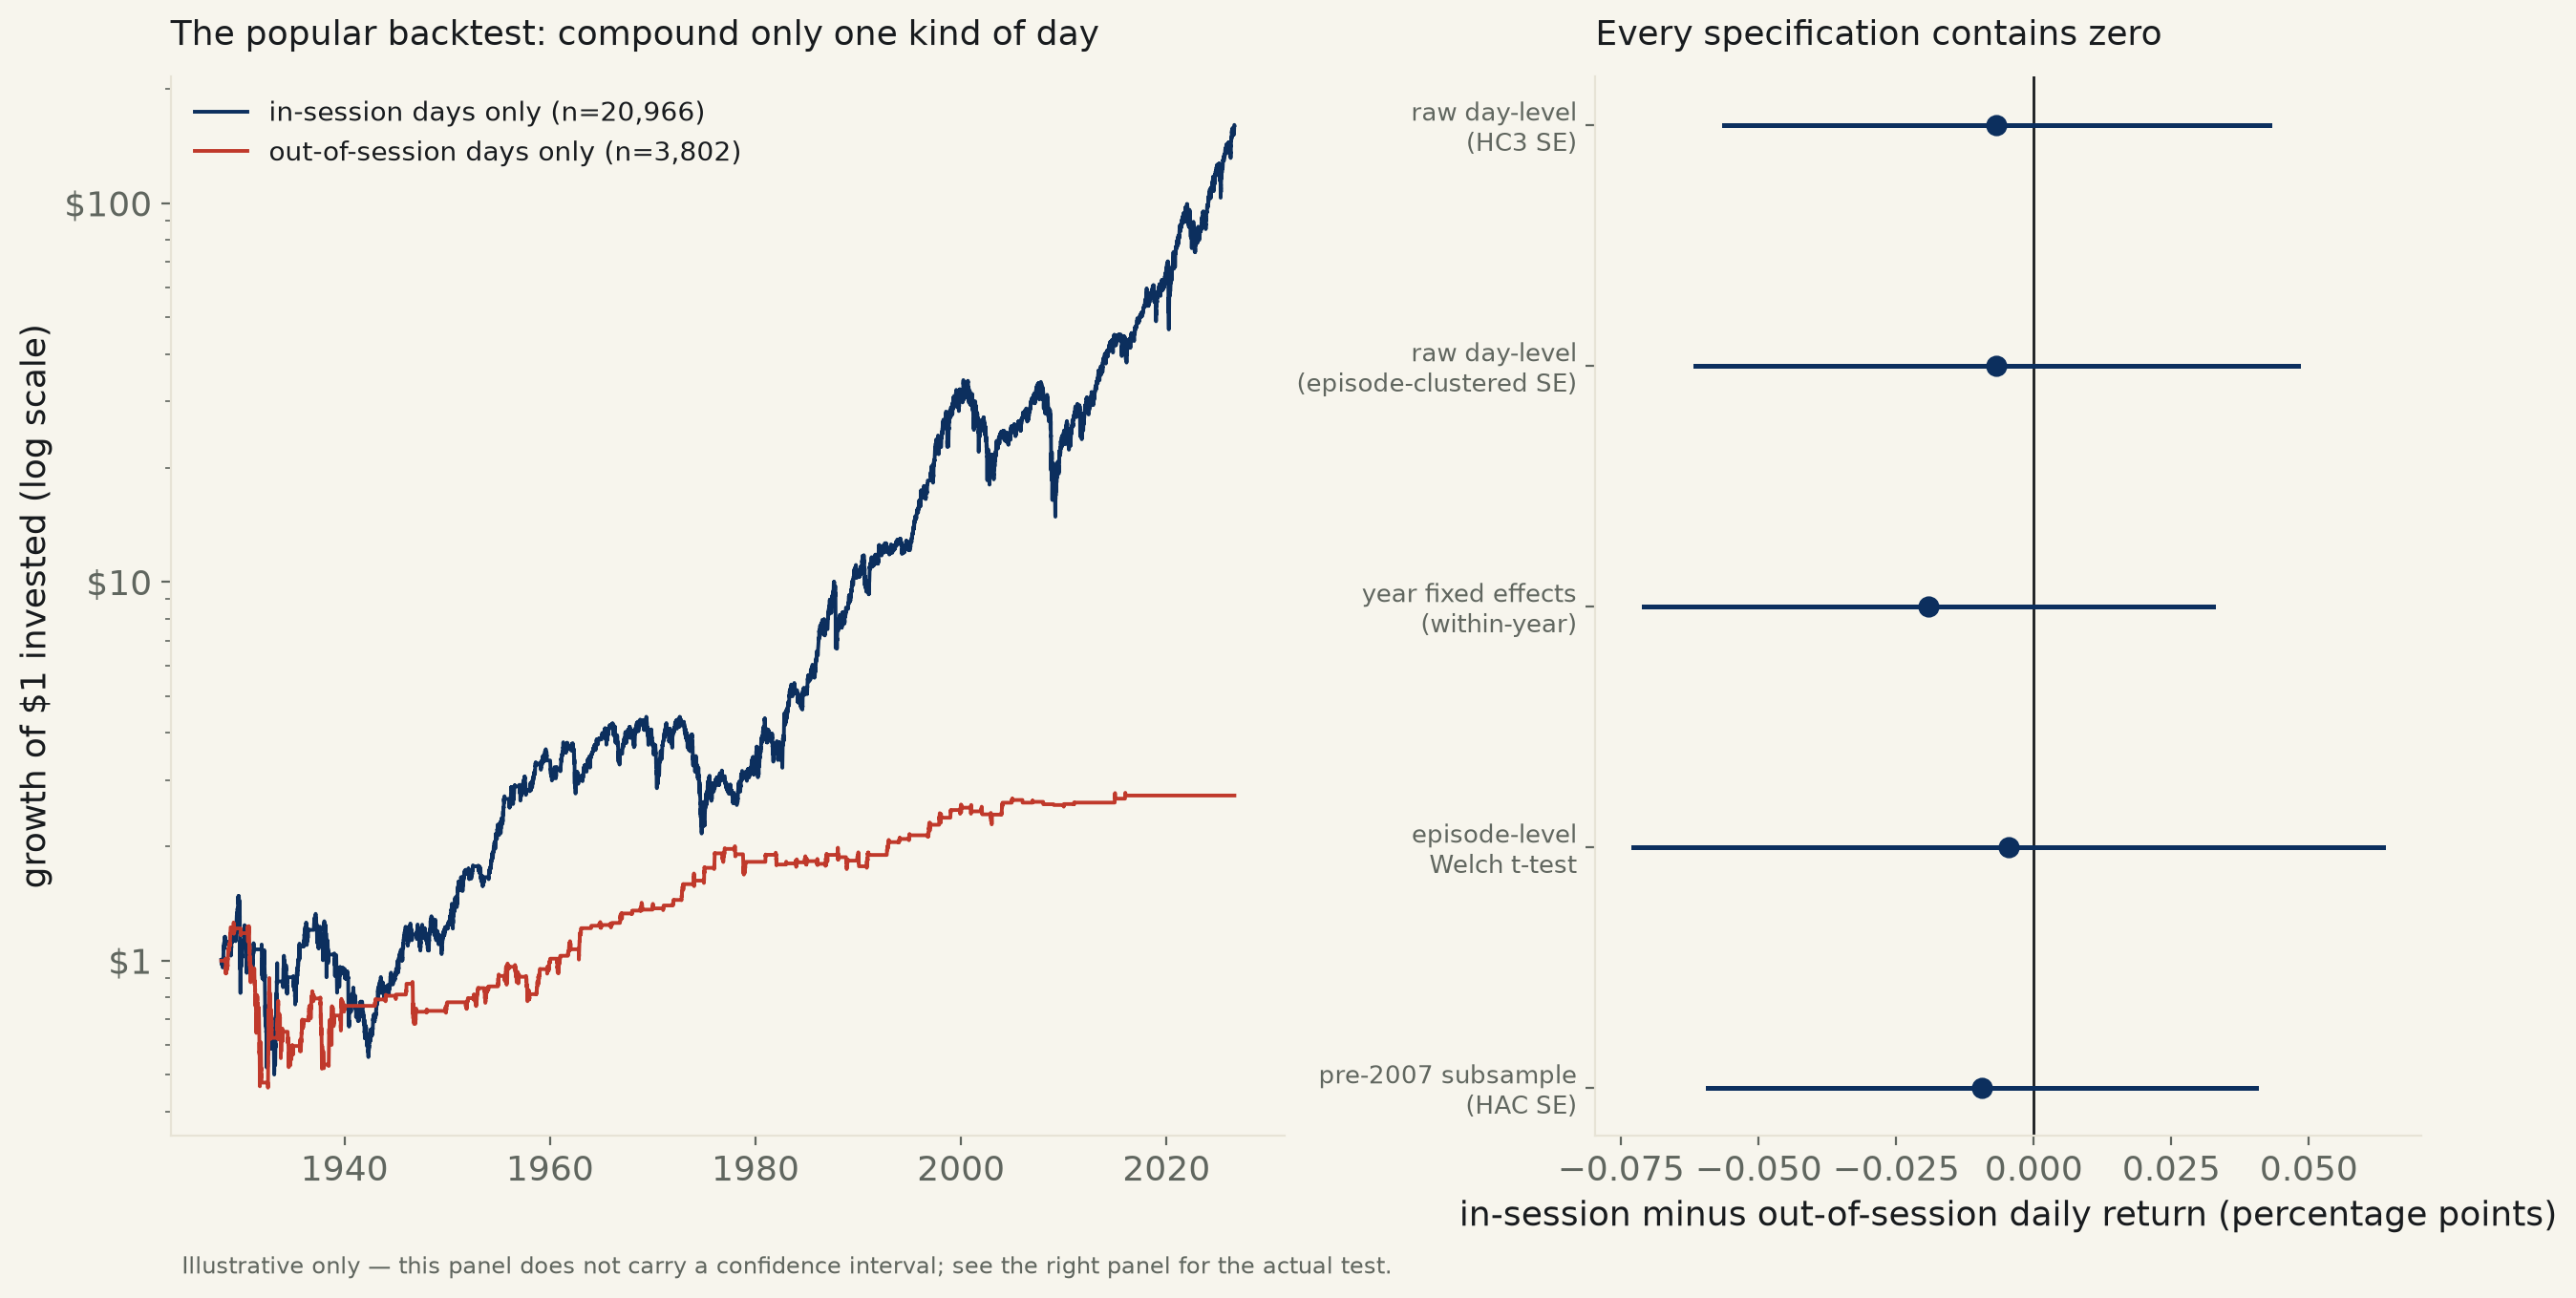
The raw numbers point the claim's own direction, barely: mean daily return +0.0306% in session vs +0.0374% out — the market really was a hair better, on average, when Congress was home. Six ways of testing whether that hair is real all return the same verdict: it isn't. Plain OLS (HC3 SE): -0.0068 pp, 95% CI [-0.0563, +0.0428], p=0.79. Newey-West and episode-clustered standard errors (daily stock returns are not independent day to day, so a naive SE understates the true noise) barely move it. Year fixed effects — comparing in-session and out-of-session days only against other days in the same year, so no decade-level confound can manufacture a gap — give -0.0191 pp, CI [-0.0708, +0.0326], p=0.47. And the most honest count of all, an episode-level test (a session or a recess is not 24,768 independent trials; it is one long autocorrelated stretch, and there are only 163 of those in a century — 82 in-session spells, 81 recesses), gives -0.0047 pp, CI [-0.0728, +0.0635], p=0.89. Every interval contains zero.
Compound those same two groups of days separately, though — $1 growing only on in-session days, a second $1 growing only on out-of-session days — and the chart looks like a landslide the other way: $1 becomes roughly $161 on in-session days and roughly $3 on out-of-session days. That is not a second finding; it is the same null result wearing a costume. In-session days outnumber out-of-session days 20,966 to 3,802 — about 5.5 to 1 — almost entirely because of what the next paragraph explains, so a statistically identical daily return compounds across roughly five and a half times as many periods. Multiply a near-equal number by itself 20,966 times instead of 3,802 times and it will win the growth-of-$1 chart even at dead-even odds; this is arithmetic doing an optical trick, not evidence.
The out-of-session sample itself is not spread evenly across the century, and the reason matters. By decade, the share of trading days classified out of session runs 31% (1920s, partial), 46% (1930s), down to 8% during the wartime 1940s (Congress met almost continuously), back up through 12%–30% in the 1950s–1990s — then collapses: 5.6% in the 2000s, 1.2% in the 2010s, exactly 0% so far in the 2020s. That last collapse is not a data problem; it is Congress's own practice changing. Since roughly 2007 both chambers hold brief pro forma sessions (gavel in, gavel out, no business) specifically so they are never, on the formal record, adjourned for more than three days — a maneuver aimed at blocking recess appointments, with the side effect that the Senate's own official session table now shows almost no "out of session" time at all after that point. The test still has power because it draws on the full century, and a pre-2007 subsample (out-of-session share a healthy 19%, n=19,836) returns the same null — -0.0094 pp, CI [-0.0592, +0.0403], p=0.71 — so the modern collapse in variance is a caveat about statistical power going forward, not the reason for today's result.
| specification (in-session minus out) | daily diff | 95% CI | p | n | verdict |
|---|---|---|---|---|---|
| raw day-level (HC3 SE) | -0.0068 pp | [-0.0563, +0.0428] pp | 0.79 | 24,768 | contains 0 |
| raw day-level (Newey-West HAC, 10-day) | -0.0068 pp | [-0.0554, +0.0419] pp | 0.79 | 24,768 | contains 0 |
| raw day-level (clustered by episode) | -0.0068 pp | [-0.0616, +0.0481] pp | 0.81 | 24,768 | contains 0 |
| year fixed effects (within-year) | -0.0191 pp | [-0.0708, +0.0326] pp | 0.47 | 21,101 | contains 0 |
| episode-level Welch t-test | -0.0047 pp | [-0.0728, +0.0635] pp | 0.89 | 163 | contains 0 |
| pre-2007 subsample (HAC) | -0.0094 pp | [-0.0592, +0.0403] pp | 0.71 | 19,836 | contains 0 |
| decade | share of trading days out of session | n days |
|---|---|---|
| 1920s | 31.5% | 499 |
| 1930s | 45.6% | 2,496 |
| 1940s | 8.2% | 2,500 |
| 1950s | 30.3% | 2,511 |
| 1960s | 18.1% | 2,489 |
| 1970s | 11.5% | 2,526 |
| 1980s | 12.0% | 2,528 |
| 1990s | 12.9% | 2,528 |
| 2000s | 5.6% | 2,515 |
| 2010s | 1.2% | 2,516 |
| 2020s | 0.0% | 1,660 |
Method. Session dates come from senate.gov's own table of every Congress's convening ("Begin Date") and sine-die-adjournment ("Adjourn Date") date, Congress 1 through 119, parsed directly from the page's HTML (its multi-session cells stack dates with <br> tags that pandas' table reader mangles, so this pull walks the raw markup instead). The still-open 119th Congress's second session (convened 2026-01-03, not yet adjourned) is treated as covering through the last pulled trading day. Overlapping or touching session spans — a handful in the 18th century, where a special session sat inside a regular one, or a session's last day coincides with the next session's first — are merged into non-overlapping spans before classification, and it is those merged spans (not the raw Senate table rows) that define the "episode" count used for the episode-level test. Prices are Yahoo Finance's ^GSPC daily close via yfinance, the full history the ticker carries. Six specifications are reported rather than one because daily stock returns are volatility-clustered and serially correlated, in-session/out-of-session status is itself a slow-moving, highly autocorrelated state (the same value for weeks or months at a stretch), and a raw day-level OLS with ordinary standard errors would understate the true uncertainty in exactly the direction that makes a null result look significant.
Limits, stated plainly. This tests whether the Senate's own official record of session boundaries predicts returns — it does not capture within-session recesses (a chamber can be, and often is, on its August break for weeks while formally still "in session" on this table), so the classification is coarser than actual floor activity, especially after Congress began routine pro forma sessions (~2007 onward) specifically to avoid a formal adjournment longer than three days; by the 2020s this record shows essentially zero out-of-session time, which is a real change in institutional practice, not a data error, but it does mean this test's power for the most recent 15-20 years specifically is thin (the pre-2007 subsample check exists for exactly this reason). This uses the House-blind Senate calendar as a proxy for "Congress"; the two chambers' session calendars are very close but not always identical, and this run does not reconcile them. And this is price-return only (^GSPC), not a total-return series — irrelevant to the question asked here (a same-period mean comparison, not a cumulative return), but worth flagging since other runs on this desk (031) used total return for a different kind of comparison.
congress_sessions.csv · sp500_daily.csv · fit output (JSON).
yfinance (keyless, daily close, 1927-12-30–present).
Compare: Ferguson, T. & Witte, H.D., "Congress and the Stock Market" (2006 update of a 2003 working paper).
