FRED’s 10-year-minus-2-year Treasury spread and NBER’s own recession dates, 602 months, 1976-06–2026-07. Inverted months precede a recession within a year 50.5% of the time vs 15.1% otherwise (95% CI excludes zero) — a real signal, but one explaining barely a ninth of the variance. Ten of eleven resolved inversions since 1976 did precede a recession. The eleventh — July 2022 — is still running: 48 months and counting, already past every prior wait on record.

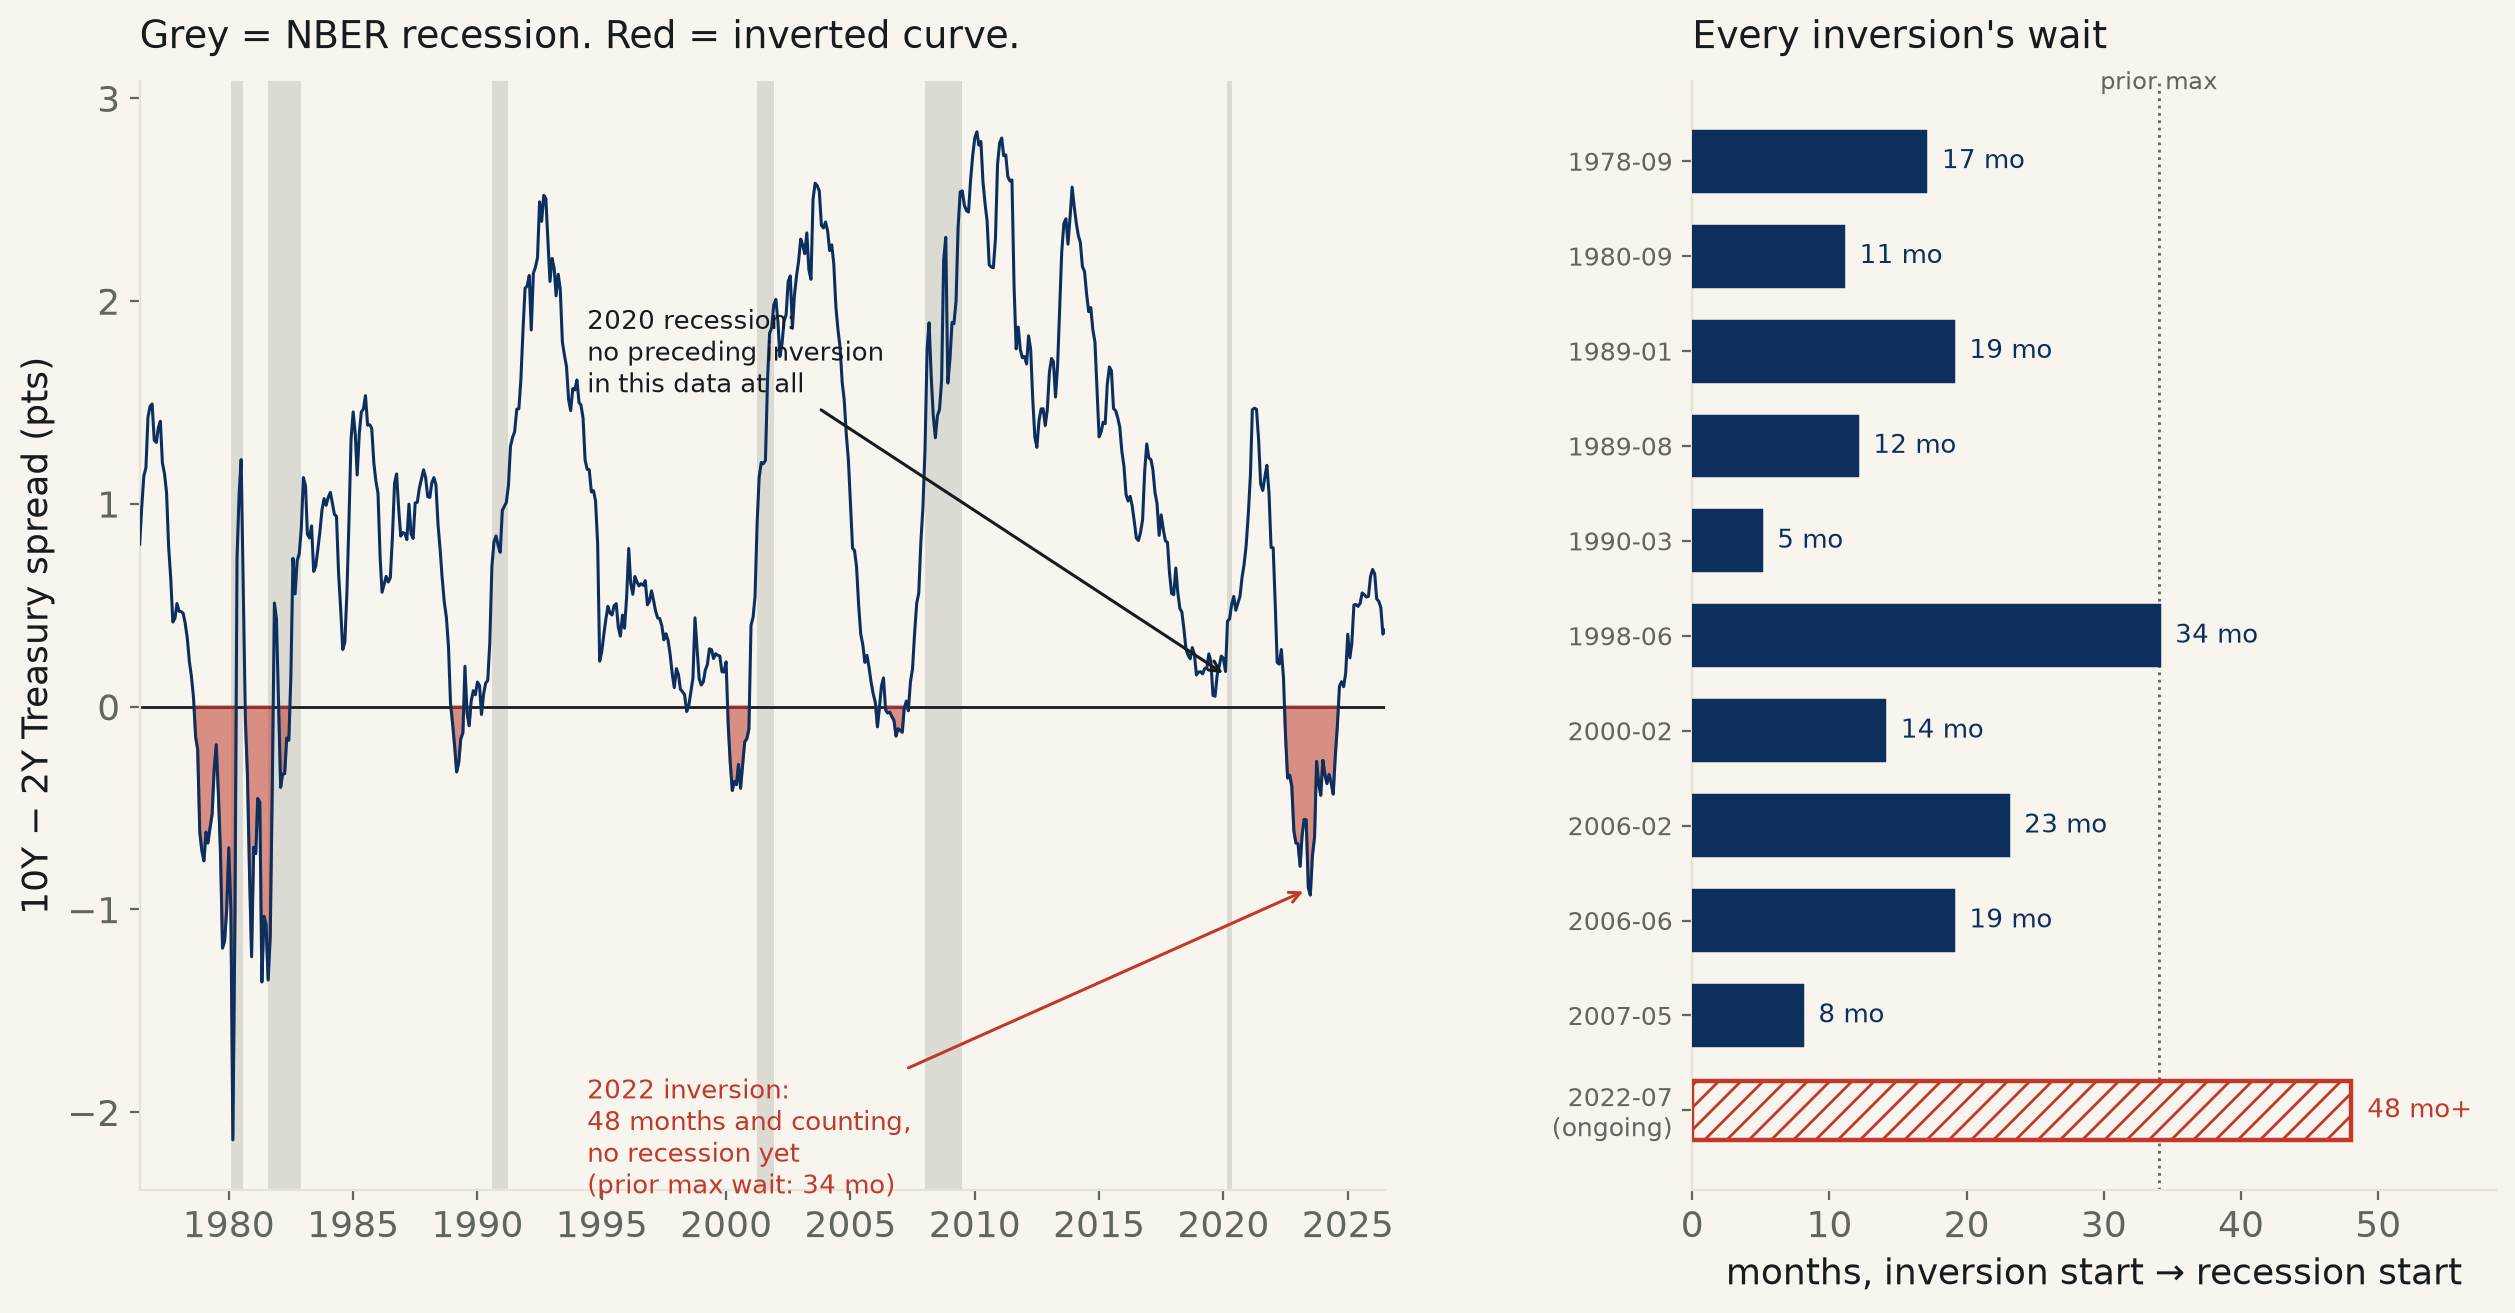
"The yield curve inverted" is the closest thing macroeconomics has to a fire alarm — when long-term Treasury yields fall below short-term ones, a recession is supposed to follow. It is also one of the field's better-tested claims: the 10-year-minus-2-year spread has been tracked daily since 1976, and the NBER has been dating US recessions since long before that, so this is a claim that can simply be counted rather than argued about. Monthly spread averaged from FRED's T10Y2Y series, joined to FRED's own machine-readable coding of NBER recession dates (USREC), 602 months, 1976-06 to 2026-07.
Fit as a linear probability model — does this month's spread predict whether a recession starts sometime in the next 12 months — the signal is real. A one-point-lower spread this month is associated with a 15.0-point higher probability of a recession inside the following year (95% CI [-0.184, -0.117], p=2.6e-17) — excludes zero comfortably. Collapsed to a simple inverted/not-inverted split: when the curve was inverted, a recession followed within a year 50.5% of the time (99 months); when it wasn't, 15.1% of the time (491 months) — a 35.4-point gap, CI [27.1, 43.8] points. But R²=0.115: the spread explains roughly a ninth of the variance in the 12-months-out outcome, not most of it. And the caveat that matters more than usual here: fwd12_recession windows overlap by 11 of 12 months between adjacent rows, so consecutive observations are almost duplicate outcomes -- the effective independent sample size is closer to n_months_total/12 than to the raw n; the p-values and CIs above are standard OLS output on the raw (overlapping) panel and are almost certainly narrower than they should be.
The episode-level read needs no regression, and it is where the "law" earns its "outlier." Since 1976 the curve has inverted 12 separate times. Excluding the one stretch (Feb–Jun 1982) that happened inside a recession already underway rather than before one, 10 inversions have a resolved outcome, waiting a mean of 16.2 months (median 16, range 5–34) for the recession that followed. All ten did eventually get one.
Two episodes don't fit that story at all. First, a miss in the other direction: the 6 recessions since 1976 include one — March 2020 — with no preceding inversion whatsoever in this data; the nearest prior inversion had ended in 2007-05, 154 months earlier, a gap the "within 24 months" rule of thumb doesn't come close to covering. The curve simply never rang for a pandemic-triggered recession, because nothing about a viral outbreak shows up in a bond spread in advance. Second, and current: the curve inverted again in July 2022, deeper and longer than every episode except the 1978–80 one, and as of this data's cutoff it has now run 48 months without a recession — already 14 months past the longest wait ever recorded before it resolved one way or the other (34 months, the 1998 inversion before the 2001 recession). Nothing here says that streak ends clean; the honest reading is that the 2022 signal is either the longest true lag on record, still ahead of it, or the first unambiguous false alarm in the series — and this data cannot yet tell you which.
| linear probability fit | coef | 95% CI | R² | p | n | verdict |
|---|---|---|---|---|---|---|
| recession-in-12mo ~ spread (pts) | -0.1504 | [-0.1843, -0.1166] | 0.115 | 2.6e-17 | 590 | excludes 0 |
| recession-in-12mo ~ inverted (0/1) | +0.3543 | [+0.2708, +0.4379] | 0.106 | 5.6e-16 | 590 | excludes 0 |
| inversion start | inversion end | months inverted | deepest spread | lag to recession | outcome |
|---|---|---|---|---|---|
| 1978-09 | 1980-04 | 20 | -2.14 | 17 mo | → recession |
| 1980-09 | 1981-10 | 14 | -1.36 | 11 mo | → recession |
| 1982-02 | 1982-06 | 5 | -0.40 | — | inside prior recession (excluded) |
| 1989-01 | 1989-06 | 6 | -0.32 | 19 mo | → recession |
| 1989-08 | 1989-09 | 2 | -0.09 | 12 mo | → recession |
| 1990-03 | 1990-03 | 1 | -0.04 | 5 mo | → recession |
| 1998-06 | 1998-06 | 1 | -0.02 | 34 mo | → recession |
| 2000-02 | 2000-12 | 11 | -0.41 | 14 mo | → recession |
| 2006-02 | 2006-03 | 2 | -0.10 | 23 mo | → recession |
| 2006-06 | 2007-03 | 10 | -0.14 | 19 mo | → recession |
| 2007-05 | 2007-05 | 1 | -0.02 | 8 mo | → recession |
| 2022-07 | 2024-08 | 26 | -0.93 | 48 mo | still waiting |
Method. Source: FRED's keyless csv endpoint (fred.stlouisfed.org/graph/fredgraph.csv?id=<SERIES>), the same pull pattern used for run 028. T10Y2Y (daily, since 1976-06-01) is averaged to a monthly mean; USREC (monthly, since 1854, FRED's own coding of the NBER Business Cycle Dating Committee's official recession months) is joined on the calendar month. The forward-12-month recession flag for month t is 1 if any of months t+1 through t+12 is a recession month; the final 12 months of the panel can't yet know their own future and are dropped from the regression (12 months excluded). Inversion episodes are runs of consecutive months with a negative monthly-mean spread; one episode (Feb–Jun 1982) is excluded from the lag-to-recession statistic because it began while the 1981–82 recession was already underway, not before one — a genuine case of the curve re-steepening as short rates got cut mid-recession, not a predictive instance.
Limits, stated plainly. The headline linear-probability-model CI is computed on overlapping 12-month windows — adjacent months share 11 of 12 outcome months, so consecutive rows are nearly duplicate observations and the effective independent sample size is closer to 602/12 ≈ 50 than to the raw n=590; the reported p-values and intervals are standard OLS output on that overlapping panel and are almost certainly narrower than a block-bootstrap or Newey-West correction would return, though the point estimates themselves would not move. Six recessions and eleven inversion episodes since 1976 is a small n for "how long is the lag" as a distribution — the mean and median above describe this one 50-year sample, not a law. NBER dates recessions with a lag of its own (sometimes over a year after they start), so the most recent months of USREC could in principle still be revised. And this fits a spread level to a binary outcome with OLS (a linear probability model), not a logit/probit — chosen for consistency with the desk's house method (an OLS slope, R², p, and CI every run) at the cost of allowing fitted probabilities outside [0,1] at the extremes, which does not occur in this range of the data.
