1,653 npm packages, log-spaced by download rank from #1 to roughly #2,000,000 (ecosyste.ms, joining the npm registry and GitHub in one record). log(downloads) on log(stars): slope 0.63 (95% CI [0.56, 0.70]) — real, excludes zero by a wide margin. But R² = 0.157: stars explain 16% of how much a package gets used. Infrastructure everyone depends on and nobody visits sits at one end; projects people admire and rarely install sit at the other.

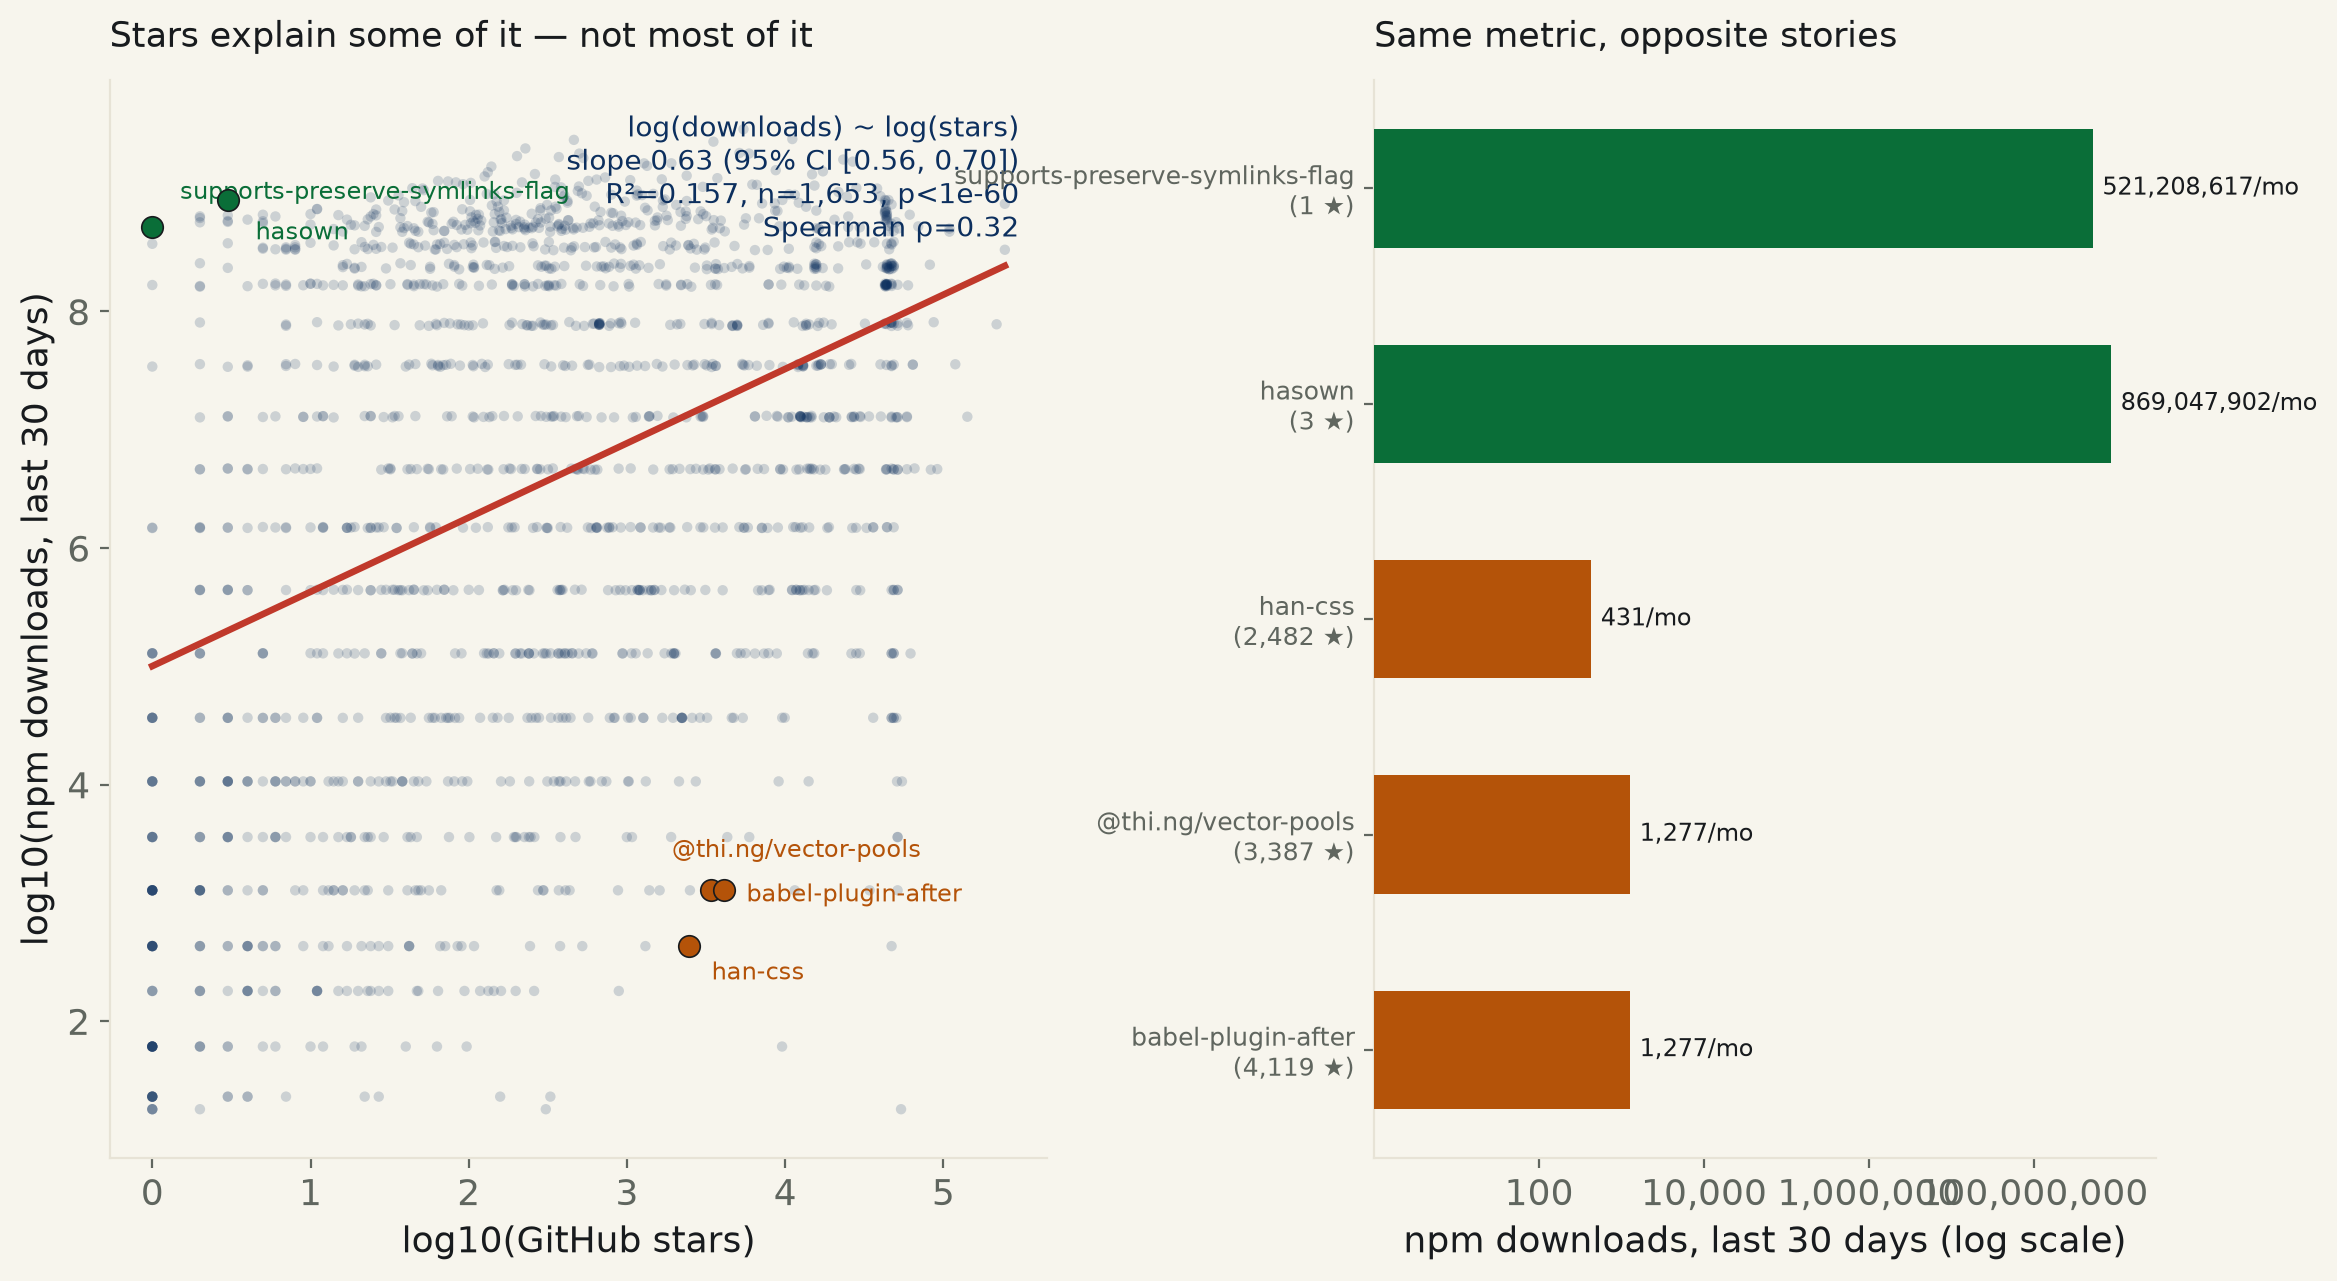
“Do GitHub stars predict actual usage?” is a question with a built-in accusation: that a star is a click, a real install is work, and the internet confuses the two. It is testable, because two different systems each keep an honest count — GitHub counts stars per repository, npm counts installs per package — and a third-party mirror, ecosyste.ms, joins them without either side knowing the other is being audited. Sampled 1,653 npm packages, log-spaced by download rank from #1 down to roughly #2,000,000, so the fit isn’t just the fifty mega-packages everyone has already heard of: stars run from 1 to 244,577, downloads from 18 to 3,476,192,085 a month — six and five orders of magnitude respectively.
Regress log(downloads) on log(stars) and the slope is 0.63 (95% CI [0.56, 0.70]) — positive, and nowhere near zero, p < 1e-60. The interval is not the story. The R² is: 0.157. Knowing a package's star count buys back 16% of the variance in how much it's actually installed and leaves the other 84% to whatever stars don't measure. Spearman's rank correlation, which doesn't care about the exact shape of the line, agrees: ρ = 0.32. The idea's own one-line prediction — “weak, vanity metric” — is correct on both counts: weak, and real.
One honest complication, checked before it could be called an oversight: stars belong to a GitHub repository, downloads belong to an npm package, and a monorepo (DefinitelyTyped, Babel, the AWS SDK) can ship hundreds of packages off one repo, all sharing its single star count. That inflates the row count without adding real information about the stars–downloads relationship. Collapsed to one row per repository — keeping the most-downloaded package as each repo's representative — the fit barely moves: slope 0.71, R²=0.150, n=1,348. The monorepo structure wasn't propping up the number.
A second complication was not so easily dismissed. The single largest “huge repo, almost no downloads” readings in the raw data turned out to be an artifact of npm's own trust model: a package's package.json can declare any GitHub URL as its repository field, checked or not. A two-version package published in October 2023 under the name ysn-element-ui-14 claims ElemeFE's 54,000-star element repository and gets 18 downloads a month; a scoped package called @assetchain/aws-amplify claims the real aws-amplify repo and gets 61. Both are real npm packages with real, verified metadata — they stay in the regression, which doesn't know or care what a name means — but they are excluded from the table below, because the point of that table is a real project people starred but mostly didn't install, and a repo-URL squat demonstrates the opposite: that the count itself can be gamed with a copy-paste.
| fit | slope | 95% CI | R² | p | n |
|---|---|---|---|---|---|
| all packages | 0.628 | [0.558, 0.698] | 0.157 | 3.2e-63 | 1,653 |
| one row per repo (monorepos collapsed) | 0.710 | [0.620, 0.800] | 0.150 | 1.8e-49 | 1,348 |
| dependents count, not downloads | 0.339 | [0.293, 0.386] | 0.128 | 1.3e-43 | 1,405 |
| package | stars | downloads/mo | downloads per star | repo |
|---|---|---|---|---|
| supports-preserve-symlinks-flag | 1 | 521,208,617 | 521,208,617 | inspect-js/node-supports-preserve-symlinks-flag |
| side-channel-weakmap | 1 | 493,028,309 | 493,028,309 | ljharb/side-channel-weakmap |
| side-channel-map | 1 | 481,560,876 | 481,560,876 | ljharb/side-channel-map |
| hasown | 3 | 869,047,902 | 289,682,634 | inspect-js/hasOwn |
| gopd | 2 | 637,513,945 | 318,756,972 | ljharb/gopd |
| dunder-proto | 2 | 617,288,653 | 308,644,326 | es-shims/dunder-proto |
| possible-typed-array-names | 1 | 373,532,337 | 373,532,337 | ljharb/possible-typed-array-names |
| es-set-tostringtag | 2 | 567,441,724 | 283,720,862 | es-shims/es-set-tostringtag |
All eight are dependency-graph shims (symlink detection, object-key checks, prototype internals) — the kind of package that gets required by thousands of other packages and visited by almost no one.
| package | stars | downloads/mo | downloads per star | repo |
|---|---|---|---|---|
| image-cropper.js | 307 | 18 | 0.1 | ElemeFE/image-cropper |
| @aws-lite/acm-types | 328 | 23 | 0.1 | aws-lite/aws-lite |
| @pandasquad/design-system | 158 | 23 | 0.1 | hackclub/design-system |
| @expo-google-fonts/katibeh | 888 | 180 | 0.2 | expo/google-fonts |
| han-css | 2,482 | 431 | 0.2 | ethantw/Han |
| @odopod/odo-scroll-feedback | 27 | 23 | 0.9 | odopod/code-library |
| abacus-api-clients | 97 | 61 | 0.6 | cloudfoundry-attic/cf-abacus |
| tanstack-query-builder | 22 | 23 | 1.0 | KurtGokhan/tanstack-query-builder |
A monorepo's flagship gets the stars; its lesser-used sub-packages (a font family, a types-only build, an internal plugin) keep the same star count and a fraction of the downloads.
Method. Source: ecosyste.ms's public, keyless API, which mirrors the npm registry joined with each package's linked GitHub repository metadata in a single record — sidestepping GitHub's 60-request/hour unauthenticated rate limit entirely. Sampling: pages of 100 packages each, log-spaced (Fibonacci-like) by download-rank position from #1 to roughly #2,000,000, so the fit spans the full popularity range rather than only the packages a reader has already heard of. A package is kept only if it reports both a nonzero star count and a nonzero download count and carries a linked GitHub repository; 1,653 packages cleared that bar. The regression is ordinary least squares of log10(downloads) on log10(stars); a companion fit substitutes dependent_packages_count (how many other npm packages import this one) for downloads — a usage signal a CDN cache-buster can't inflate — and lands on the same shape: slope 0.34, R²=0.128, n=1,405.
Limits, stated plainly. Downloads-last-month counts every HTTP request to the npm CDN for a package's tarball, which includes CI pipelines reinstalling on every commit, Docker layer rebuilds, and mirrors — it is a bandwidth number standing in for a usage number, the same proxy the whole npm ecosystem already uses, not a fix this run invented. Stars are a lifetime cumulative count with no decay, while downloads are a 30-day snapshot, so an old, stable, rarely-updated-but-still-installed package can look understarred relative to a currently-hyped one of the same actual footprint. The repository field in a package's manifest is self-declared and unverified by npm, which is precisely how the two excluded squats got into the extremes table in the first place — the checked list above is a sample of eight from each tail, not a census, and the desk cannot rule out further undetected squats deeper in the distribution. And this is one snapshot, taken 2026-08-08; both stars and downloads move.
