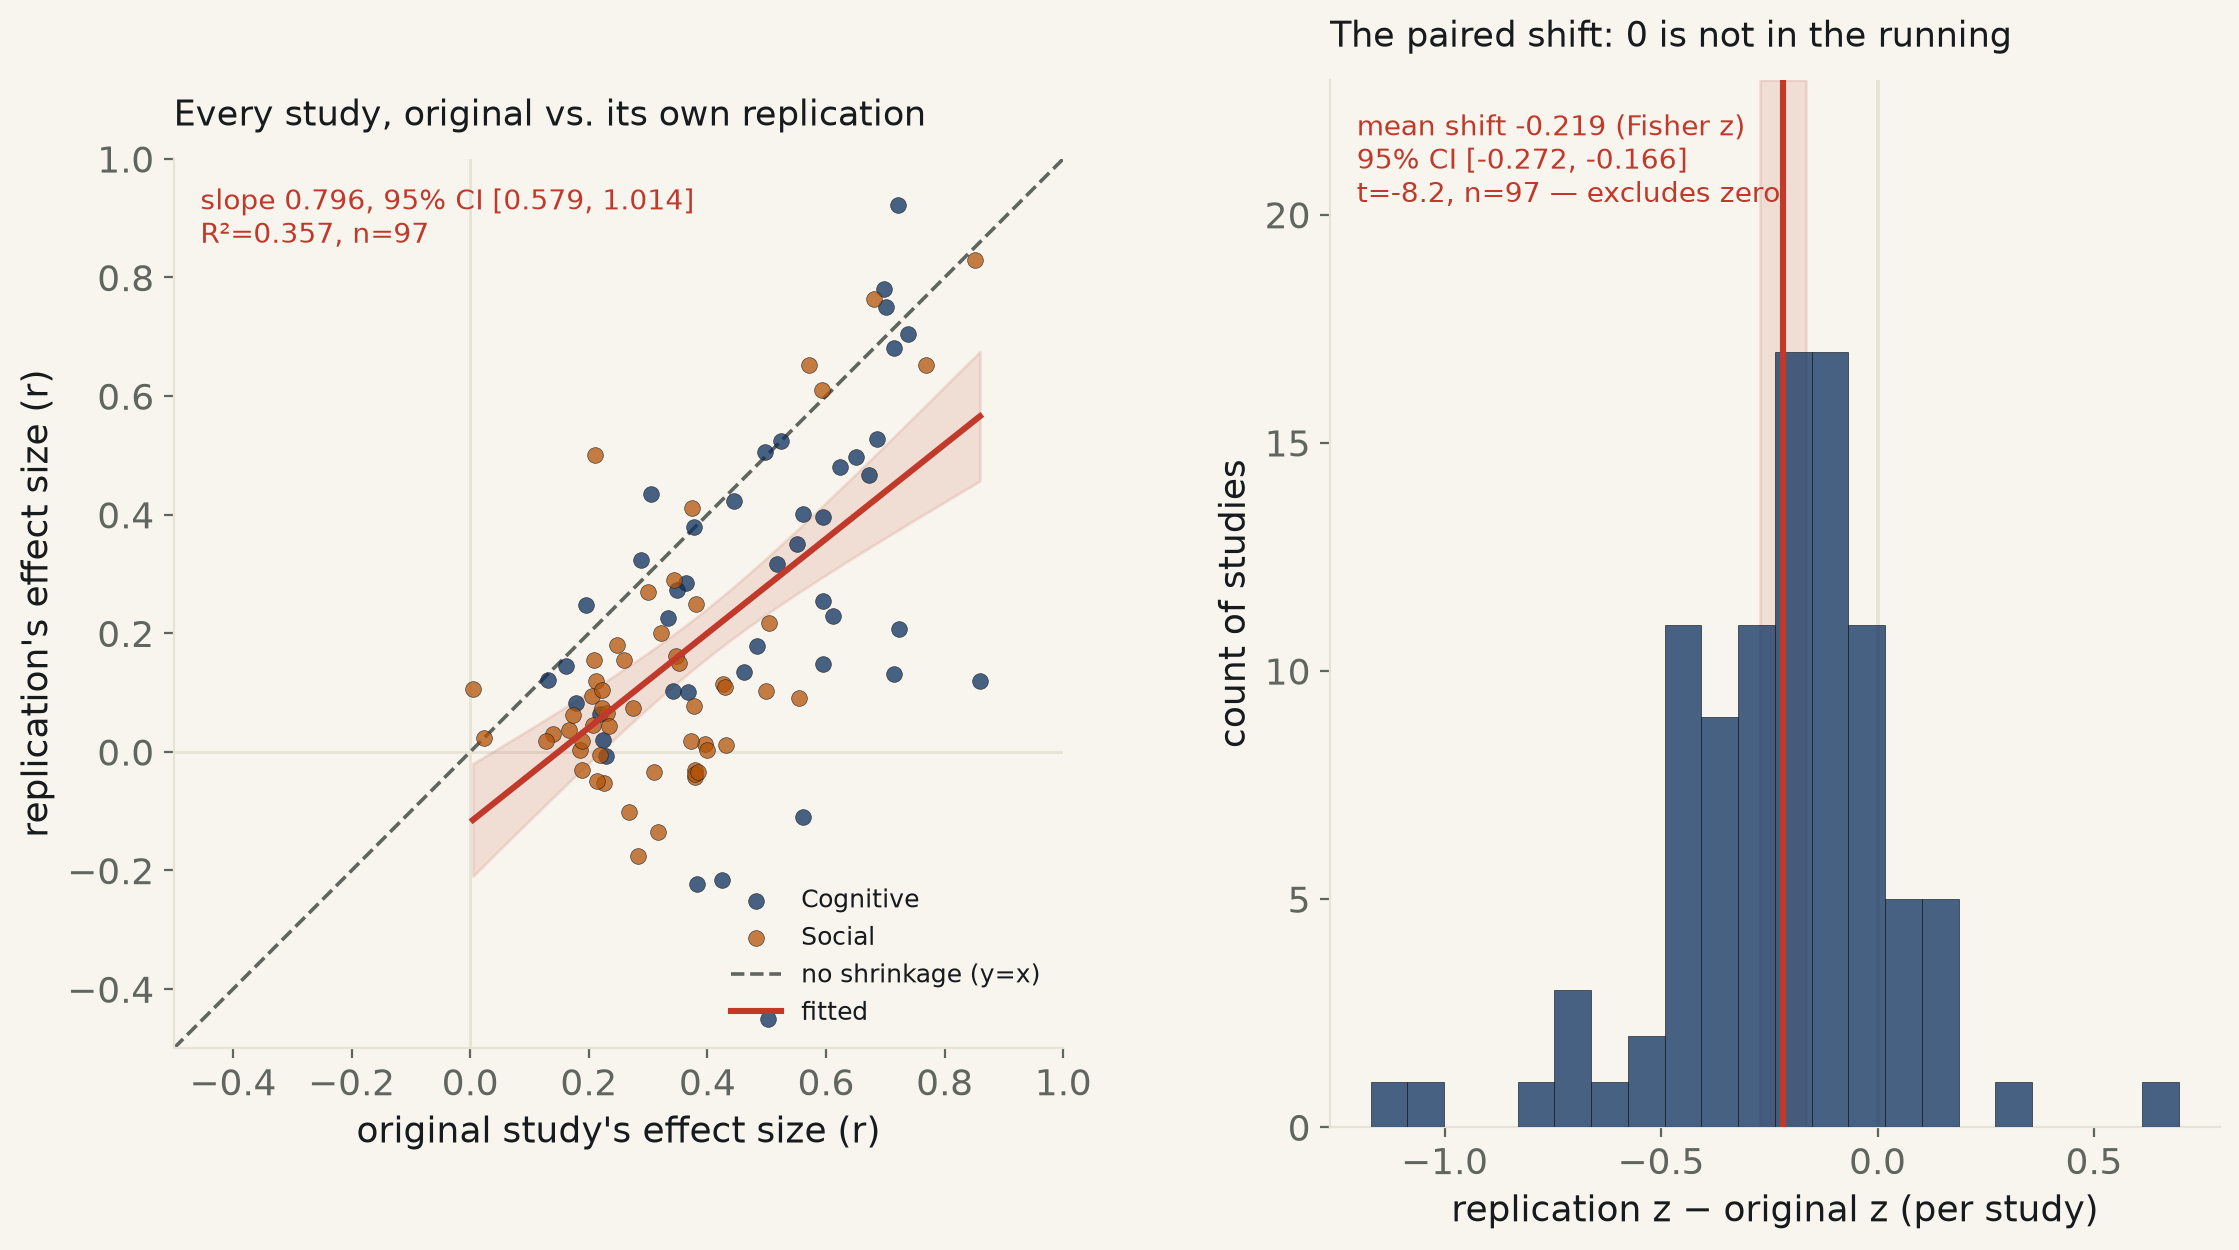
The Reproducibility Project: Psychology (Open Science Collaboration 2015) re-ran 97 studies from three top journals on the identical design. Regress replication effect size on original and the slope’s 95% CI [0.579, 1.014] barely fails to exclude “no attenuation.” The paired shift, tested properly, doesn’t have that problem: -0.219 (Fisher z), 95% CI [-0.272, -0.166] — the average effect that survives is 50% of the one that was published. Only 35% of replications clear p<.05 again; 18% flip sign entirely.
The Reproducibility Project: Psychology set out to answer a specific, checkable question: if you take a published, statistically significant finding and run the identical study again — same design, same materials where possible, a much larger volunteer team doing the same analysis — does the effect show up again, and at the same size? In 2011–2015 a consortium of 270 researchers replicated 100 studies from three of psychology’s leading journals; 97 of those pairs have a directly comparable effect size on both sides, using the project’s own published conversion of every original test statistic to a common correlation coefficient r — not a conversion invented for this page.
Regress each replication’s effect size on its own original’s: slope 0.796, 95% CI [0.579, 1.014], R²=0.357, n=97. Taken alone, that slope’s interval very nearly reaches 1.0 — it can’t quite rule out “replications scale with originals one-to-one, no systematic attenuation.” That would be the wrong place to stop. A regression slope answers a question about the relationship across studies; it says nothing about what happened within each one. Fisher-transform every pair (the correlation-appropriate scale for exactly this comparison) and run a paired test on the same 97 studies, and the ambiguity disappears: mean shift -0.219, 95% CI [-0.272, -0.166], t=-8.2, p ≈ 1×10⁻¹² — the interval isn’t close to zero. In the original r units that’s a drop from a mean of 0.396 to 0.197 — the average effect that survives is 50% of the one that was published.
How many “replicated” depends entirely on which bar gets set, so the page states all three the project itself tracked. By the simplest bar — does the replication clear p<.05 again — 34 of 97 (35%) do, against 90 of 97 (93%) of the originals (nearly all of them, because journals mostly publish findings that cleared it). By a gentler bar — does the original estimate fall inside the replication’s own confidence interval — 44 of 94 (47%). By the most forgiving bar — pool the original and replication into one meta-analytic estimate and ask if that clears significance — 51 of 75 (68%). Every version of the question lands well under 100%, and 17 of 97 (18%) replications didn’t even keep the original’s sign — “Preschoolers' perspective taking in word learning: do they blindly follow eye gaze?” ran r=0.50 the first time and r=-0.45 the second. Not every study collapsed: “The representation of simple ensemble visual features outside the focus of attention” went r=0.72 → r=0.92, p=4.9e-08 — a replication that came back stronger.
Split by field, the two disciplines shrink by a similar amount on the continuous scale (Cognitive -0.240, Social -0.203) but clear the p<.05 bar at very different rates: Cognitive psychology replicated 21 of 43 (49%), Social psychology 13 of 54 (24%) — roughly double the rate. The two numbers aren’t the same claim: a similar average shift can still cross a hard significance line at very different rates depending on how large and how tightly estimated the original effect was to begin with.
| regression fit = | slope 0.7962, 95% CI [0.5786, 1.0137] · R²=0.3571 · n=97 · p=1.03e-10 · CI barely fails to exclude 1 |
| paired shift (Fisher z) = | mean -0.2192, 95% CI [-0.2721, -0.1662] · t=-8.22 · n=97 · p=9.70e-13 · excludes zero |
| mean effect size = | original 0.3962 · replication 0.1970 · ratio 0.497 (49.7% of original) |
| significant at p<.05 = | original 90/97 (92.8%) · replication 34/97 (35.1%) |
| other replication bars = | original inside replication's 95% CI: 44/94 (47%) · pooled meta-analytic estimate significant: 51/75 (68%) |
| sign flips = | 17/97 (17.5%) · e.g. “Preschoolers' perspective taking in word learning: do they blindly follow eye gaze?”: r=0.502 → r=-0.450 |
| discipline | n | mean r (original) | mean r (replication) | mean shift (Fisher z) | replication p<.05 |
|---|---|---|---|---|---|
| Social | 54 | 0.325 | 0.133 | -0.203 | 13/54 (24%) |
| Cognitive | 43 | 0.485 | 0.277 | -0.240 | 21/43 (49%) |
Method. Data is the Open Science Collaboration’s own published master file for the Reproducibility Project: Psychology (Science, 2015): 100 studies from 2008 issues of Psychological Science, Journal of Personality and Social Psychology, and Journal of Experimental Psychology: Learning, Memory, and Cognition, each independently replicated once by a separate team following the original protocol as closely as feasible. The file already carries the project’s own harmonization of every test statistic — t-tests, F-tests, correlations, chi-square — onto a common correlation coefficient r (partial η² → r=√η², Cohen’s d → r=d/√(d²+4), etc.); this run uses that conversion rather than inventing one. 97 of the 100 pairs have both an original and a replication r; the other 3 lack a comparable replication statistic entirely (not a filtering choice made here). Shrinkage is tested on the Fisher z-transform (arctanh) of r, the standard variance-stabilizing scale for comparing correlation coefficients, with a paired t-test across the same 97 studies.
Limits, stated plainly. Every original study here was chosen for having been published, which selects for effects that cleared significance in that particular sample — publication bias and simple sampling variation guarantee that an independent re-measurement will regress toward the true effect on average, even for a real and stable phenomenon and a flawless replication. Some share of the shrinkage measured here is that guaranteed reversion, not evidence that anything specific went wrong; this run doesn’t attempt to partition how much is which; the replication project's original authors take the same position. Each study was replicated exactly once, by one team, at a single point in time — not a multiverse of replications averaged together, so a single unlucky (or lucky) sample still moves this run's per-study numbers. Replication teams and statistical power varied study to study. The 95% CI on the regression slope [0.579, 1.014] is reported honestly as failing to exclude 1 — the paired test is the stronger and correct basis for the shrinkage claim, not the slope.
