NOAA's Mauna Loa CO2 record x NASA's GISTEMP global temperature anomaly, 67 complete years (1959–2025). Temperature tracks ln(CO2) at R² = 0.931, implying 2.74 °C per CO2 doubling (95% CI [2.55, 2.92]) — in line with the textbook climate-sensitivity range. And CO2's own rate of rise is accelerating: 3.0× faster added per year now than in the 1960s, an interval that excludes zero.
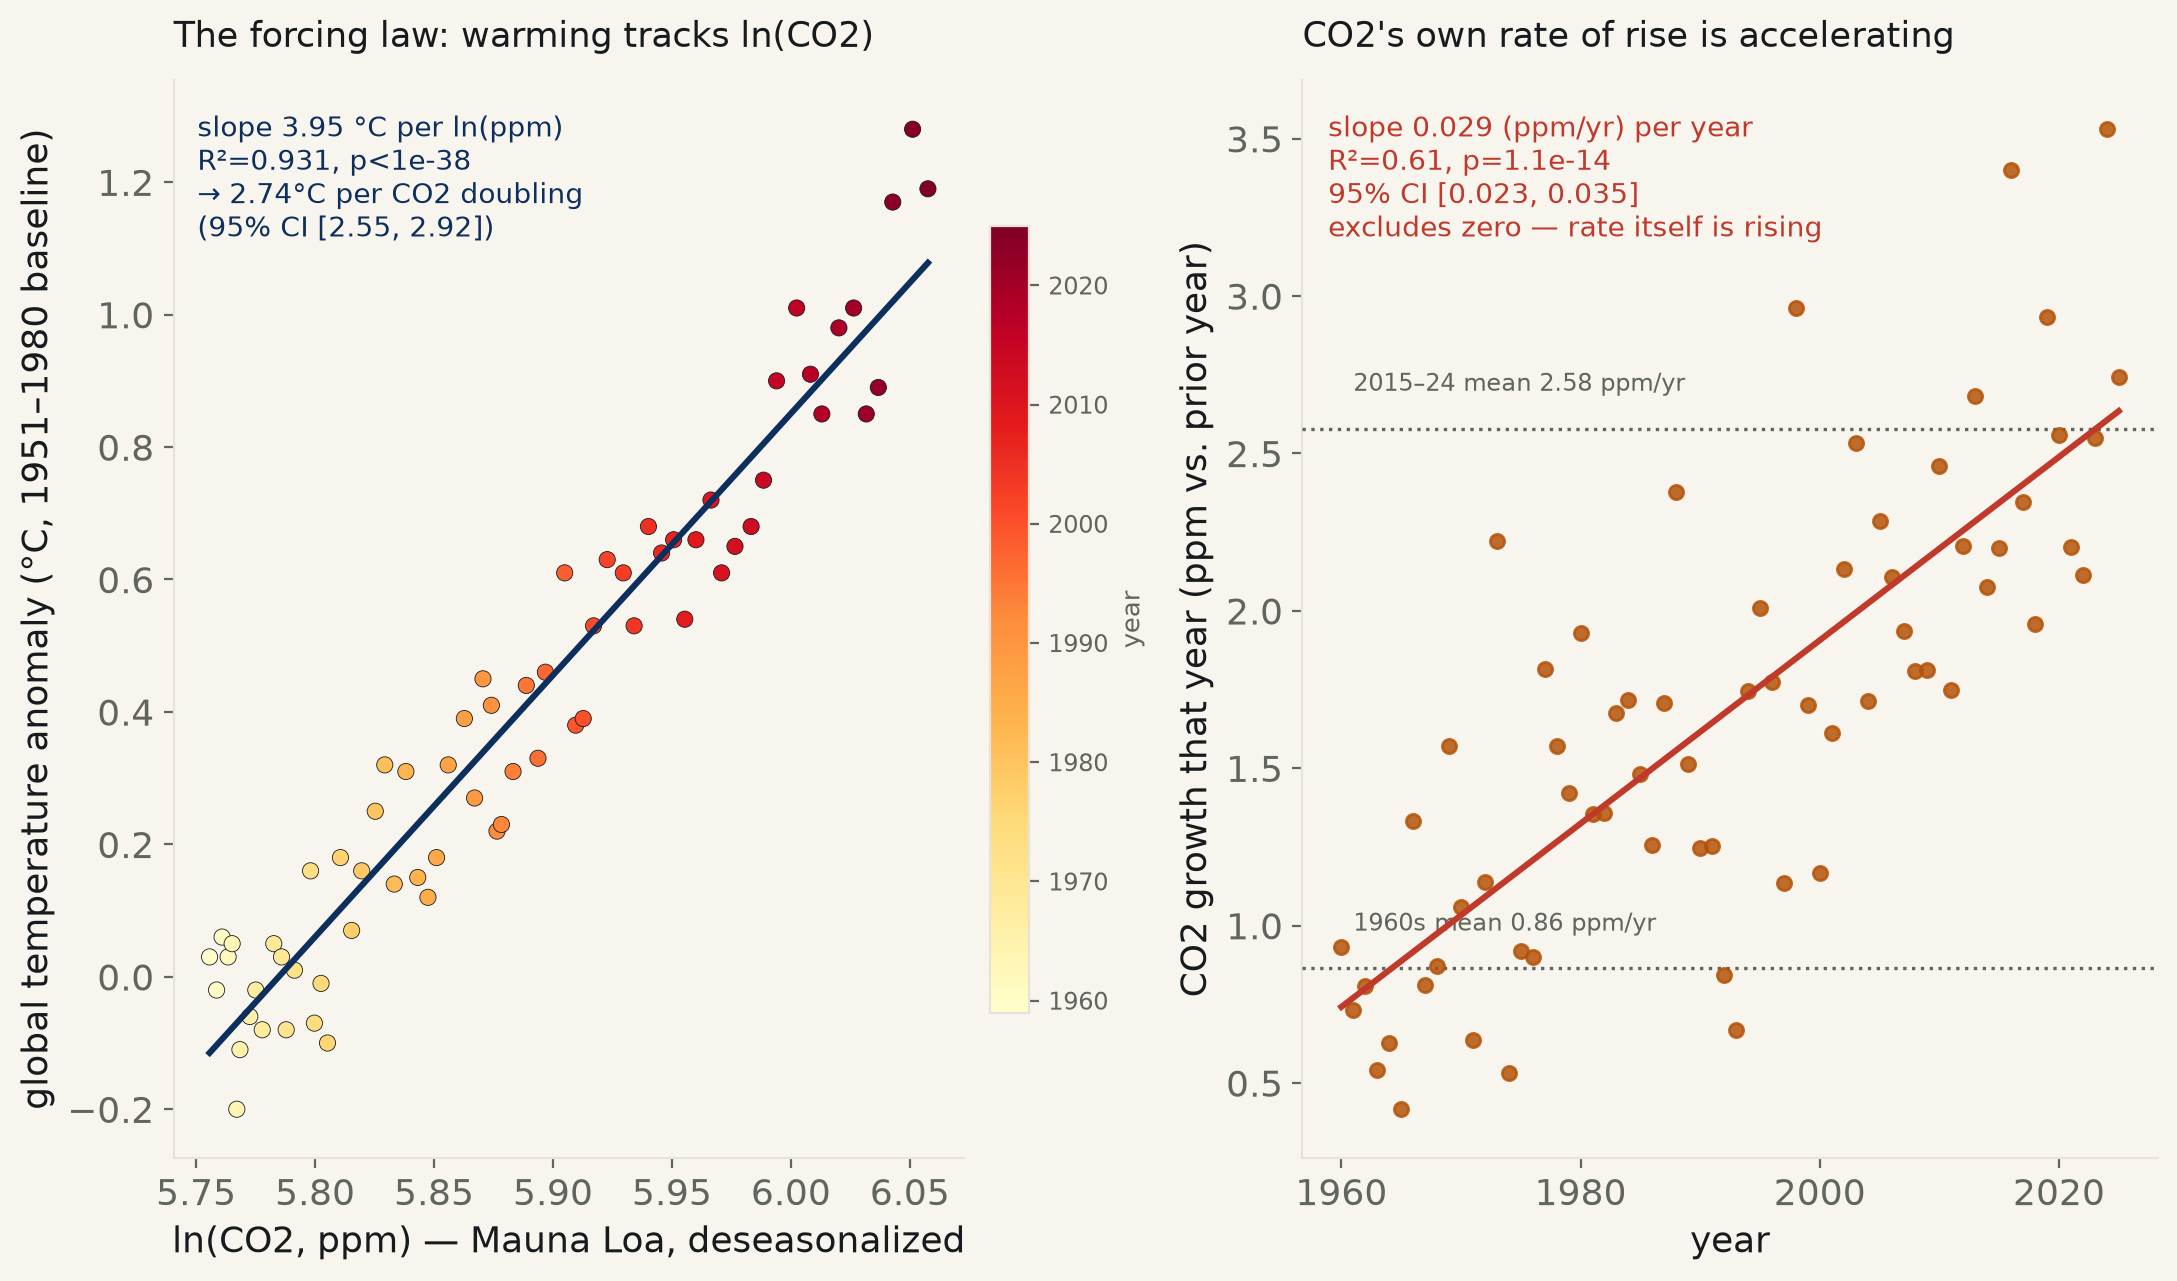
The claim behind every climate story is a specific, checkable one: adding CO2 to the atmosphere warms it, in a relationship physics predicts should track the logarithm of concentration, not concentration itself — each further molecule traps a little less additional heat than the one before it. That is a regression, and the two records needed to check it are both public and both go back decades: NOAA's Mauna Loa station has measured atmospheric CO2 continuously since 1958, and NASA's GISTEMP compiles the global surface temperature record back to 1880. Joined on the 67 calendar years both have complete (1959–2025), the anomaly regressed on ln(CO2) fits at R² = 0.931 (slope 3.95 °C per ln(ppm), 95% CI [3.69, 4.22], p < 10⁻³⁸). That slope implies 2.74 °C of warming per doubling of CO2 (95% CI [2.55, 2.92]) — in the same neighborhood as the IPCC's own multi-line-of-evidence estimate for climate sensitivity, recovered here from nothing but two public time series and one regression.
One honest wrinkle: over the actual range this record covers — CO2 rose from 316 to 427 ppm, a 35% increase, not a full doubling — a plain linear fit against CO2 concentration (no logarithm) does not lose to the log form; it fits marginally better (R²=0.9358 vs 0.9310). Across a 35% change, a slowly-curving logarithm and a straight line are close enough that this dataset cannot, by itself, tell the two functional forms apart — the log form is used here because it is the physically motivated one, not because the data demands it over the alternative. The five years the fit misses by the most are not a random scatter either: 2024 and 2023 both ran hot of the line (El Niño years), and 1976 ran cold of it (a La Niña year) — a reminder that this bivariate fit does not, and cannot, net out year-to-year ocean-cycle noise, aerosol forcing, or the other greenhouse gases that share credit for the warming trend.
A second, separate claim rides along with the first: not just that CO2 is rising, but that its rate of rising is itself accelerating — emissions outrunning the natural carbon sinks trying to absorb them. Tested directly on the year-over-year ppm increase against time (66 year-pairs): the growth rate itself climbs at +0.029 (ppm/yr) per year (95% CI [0.023, 0.035], R²=0.61, p=1.1e-14) — the interval sits nowhere near zero. The 1960s averaged 0.86 ppm added per year; 2015–2024 averaged 2.58 — 3.0× faster. The curve is not just going up. It is going up faster than it used to.
| log-linear fit = | slope 3.9516 °C/ln(ppm), 95% CI [3.6852, 4.2180] · R²=0.9310 · n=67 · p=1.8e-39 |
| … implied warming/doubling = | 2.7391 °C, 95% CI [2.5544, 2.9237] |
| linear fit (CO2 ppm, no log) = | slope 0.01085 °C/ppm, 95% CI [0.01014, 0.01155] · R²=0.9358 · over this 35% CO2 range, log and linear are not distinguishable by fit quality alone |
| CO2 growth-rate trend = | +0.02912 (ppm/yr) per year, 95% CI [0.02330, 0.03495] excludes zero · R²=0.6093 · n=66 · p=1.1e-14 |
| decade means, growth rate = | 1960s 0.864 ppm/yr vs 2015–2024 2.579 ppm/yr · 2.98× |
| CO2, first year to last = | 315.98 ppm (1959) → 427.35 ppm (2025), +35.2% |
| temperature, first 5yr vs last 5yr mean = | +0.030 °C → +1.076 °C |
| year | residual (actual − fit) |
|---|---|
| 2024 | +0.227 °C |
| 1976 | -0.181 °C |
| 1961 | +0.154 °C |
| 2023 | +0.150 °C |
| 2016 | +0.150 °C |
Method. CO2: NOAA Global Monitoring Laboratory's Mauna Loa monthly record (gml.noaa.gov, no key), the deseasonalized column (seasonal cycle removed), averaged to an annual mean for every calendar year with all 12 months present. Temperature: NASA GISTEMP v4 (data.giss.nasa.gov), the global land-ocean "J-D" (January–December) annual-mean anomaly column, °C relative to the 1951–1980 base period, kept only for years the column reports as complete. The two series are joined on calendar year; 1958 (CO2 record starts in March) and the current partial year are dropped, leaving 67 complete years. The headline fit is OLS of the temperature anomaly on the natural log of annual mean CO2; the implied warming-per-doubling multiplies that slope by ln(2). The acceleration claim is a separate OLS of the year-over-year CO2 ppm change against the calendar year, using the 66 year-over-year differences available within the same window.
Limits, stated plainly. This is a two-variable regression, not an attribution study: it does not separate CO2's own forcing from methane, other greenhouse gases, aerosols, land-use change, or ocean heat uptake lag, all of which move the real climate system and are correlated with CO2's rise over this period simply because they share a cause (industrialization). The recovered warming-per-doubling therefore reflects the net effect of everything that has moved alongside CO2 since 1959, not a controlled experiment isolating CO2 alone — that it lands close to the IPCC's dedicated multi-line-of-evidence estimate is a consistency check, not proof the two numbers measure identically defined quantities. The log-vs-linear comparison above is stated deliberately: this dataset's CO2 range is too narrow (35%, not a full doubling) to let the functional form be chosen by fit quality; the log form is used on physical grounds established elsewhere, not because R² prefers it here. Annual means also wash out any within-year dynamics (the record starts under 1959's 10-year-averaged noise floor is fine at n=67, but year-to-year points are not independent draws — ENSO and volcanic-eruption years cluster on one side of the line, visible in the residual table above).
co2_temperature.csv (67 years) · fit output (JSON).
