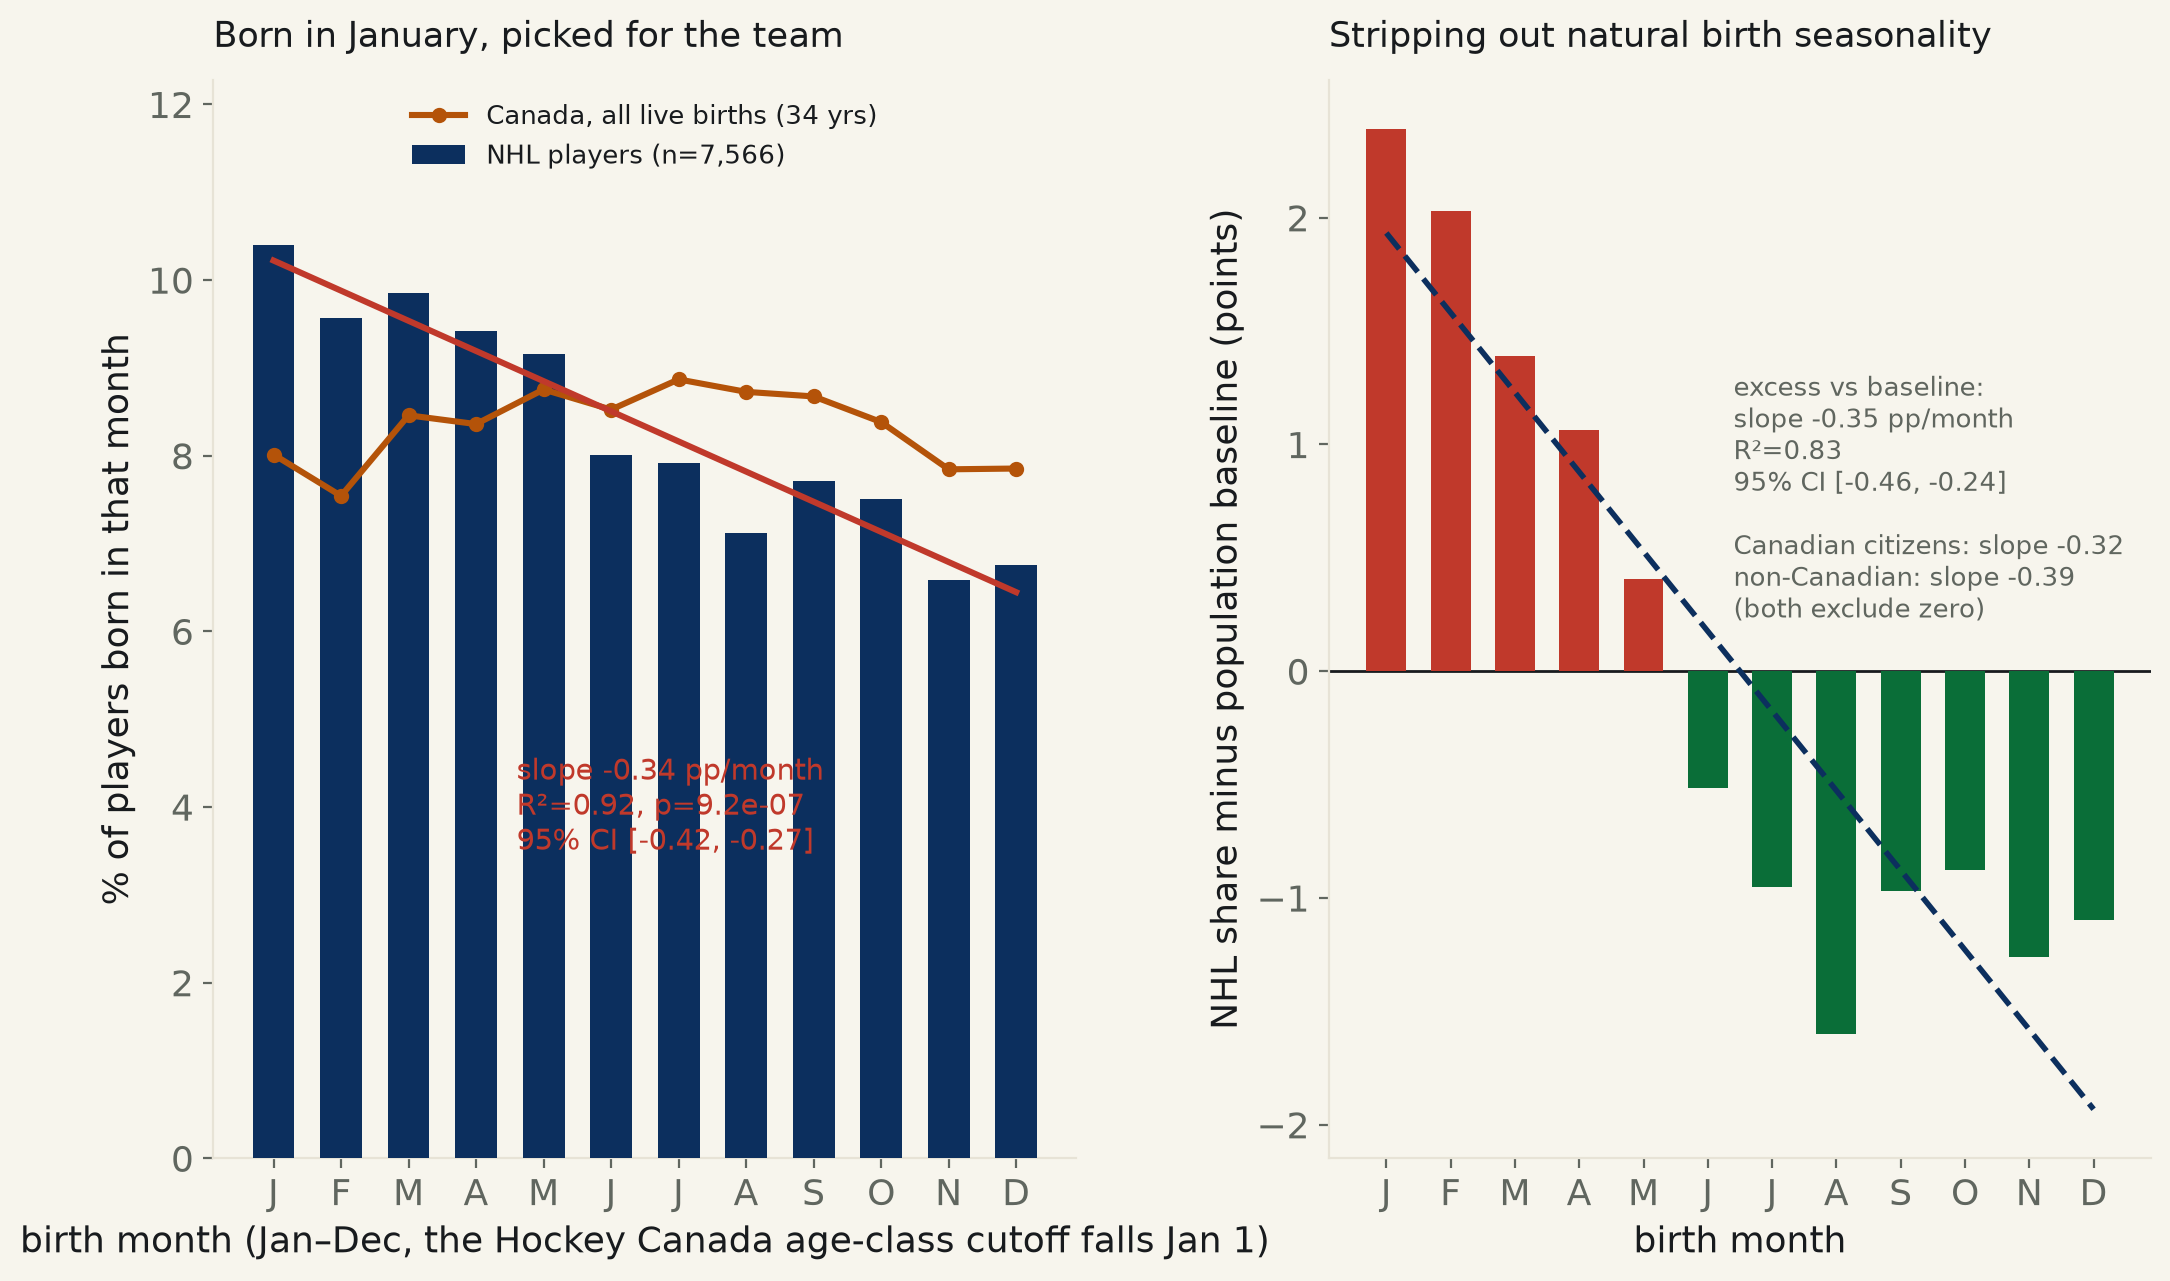
7,566 NHL players with a known birthdate (Wikidata, 1879–2004). Share born in each month falls in a straight line from January to November: slope -0.34 points/month (95% CI [-0.42, -0.27], R²=0.92). Checked against Statistics Canada's actual birth-month baseline — not an artifact of when babies are born — and checked again on Canadian citizens only, non-Canadians only, and the modern era alone. Every cut clears zero.

Every kid who has played organized hockey in North America has heard some version of it: the big kid on the team, the one who could always skate through everyone, was born in January. It is a folk theory with a mechanical cause behind it — Hockey Canada, like most national federations, sorts children into age classes by calendar year, with the cutoff falling January 1. A child born January 2 can be skating against a rink-mate born the following December 31 — a full year of childhood development apart, filed into the same age group. The bigger, more coordinated kid gets picked for the better team, the better coach, the more ice time, and the gap that started as a calendar accident compounds every season until only one shape of birthday survives to the professional level.
Wikidata carries a birthdate for 7,566 National Hockey League players, day-precision only, spanning 1879–2004. Bucket them by birth month and regress the share born in each month against the month's order from January: the share falls in a straight line, from 10.4% in January to 6.6% in November, slope -0.34 points per month (95% CI [-0.42, -0.27], R²=0.92, p=9.2e-07). A player is 1.43× more likely to have been born in the first quarter of the year than the last (29.8% vs 20.8%).
The obvious objection: maybe more babies are simply born in January. They are not — if anything the opposite. Statistics Canada's live-birth records, averaged over the 34 years the table covers, put January at 8.01% of annual births, slightly below the 8.3% a perfectly even year would produce, with the country's actual peak birth month landing in July. Subtracting that real population baseline from the NHL's month shares — the excess a hockey career adds on top of ordinary demographics — still falls in a straight line, slope -0.35 points per month (CI [-0.46, -0.24], R²=0.83). Whatever is sorting these players by birth month, it is not the calendar of human reproduction.
Two further cuts, run to see if the effect is an artifact of who Wikidata happens to have documented well: splitting the roster by citizenship, 5,094 Canadian citizens show slope -0.32 (CI [-0.39, -0.25]) and 2,472 non-Canadians show -0.39 (CI [-0.55, -0.24]) — both intervals clear of zero, which fits a cutoff that international federations largely share rather than one unique to Canadian minor hockey. And restricting to the 903 players born within the population baseline's own 1991–2024 window — the tightest apples-to-apples comparison this run can make — the slope runs steeper, not weaker, at -0.58 (CI [-0.80, -0.36]). A century-old scheduling decision is still deciding, in part, who gets to play in the NHL.
| headline (all players) = | -0.3433 pts/month, 95% CI [-0.4153, -0.2712] · R²=0.9185 · n=7,566 players · p=9.2e-07 |
| excess over population baseline = | -0.3513 pts/month, 95% CI [-0.4638, -0.2387] · R²=0.8287 · p=3.9e-05 |
| Canadian citizens only = | -0.3186 pts/month, 95% CI [-0.3883, -0.2489] · R²=0.9121 · n=5,094 · p=1.3e-06 |
| non-Canadian only = | -0.3941 pts/month, 95% CI [-0.5516, -0.2365] · R²=0.7565 · n=2,472 · p=2.4e-04 |
| modern era (born 1991–2024) = | -0.5766 pts/month, 95% CI [-0.7951, -0.3580] · R²=0.7755 · n=903 · p=1.6e-04 |
| … modern era, excess over baseline = | -0.5845 pts/month, 95% CI [-0.8317, -0.3374] · R²=0.7353 · p=3.6e-04 |
| month order | month | NHL players born (%) | Canada, all live births (%, 34-yr avg) | excess |
|---|---|---|---|---|
| 1 | January | 10.40% | 8.01% | +2.39 pts |
| 2 | February | 9.57% | 7.54% | +2.03 pts |
| 3 | March | 9.85% | 8.46% | +1.39 pts |
| 4 | April | 9.42% | 8.36% | +1.06 pts |
| 5 | May | 9.16% | 8.75% | +0.41 pts |
| 6 | June | 8.01% | 8.52% | -0.51 pts |
| 7 | July | 7.92% | 8.87% | -0.95 pts |
| 8 | August | 7.12% | 8.73% | -1.60 pts |
| 9 | September | 7.71% | 8.67% | -0.97 pts |
| 10 | October | 7.51% | 8.38% | -0.88 pts |
| 11 | November | 6.58% | 7.84% | -1.26 pts |
| 12 | December | 6.75% | 7.85% | -1.10 pts |
Method. NHL roster: Wikidata Query Service, every item tagged occupation "ice hockey player" (Q11774891) linked by "member of sports team" to a team whose league (P118) is the National Hockey League (Q1215892), with a birthdate carrying day-level precision (Wikidata timePrecision 11) — the 2 matching players whose only recorded precision is year-level are excluded, since Wikidata serializes those with a January 1 placeholder that would otherwise inflate the January count artificially. Population baseline: Statistics Canada table 13-10-0415-01, "Live births, by month," Canada total, percentage of live births by month, 34 years (1991–2024), averaged across years per month via the WDS REST API (keyless). All regressions are OLS of the percent share in each of the 12 calendar months against that month's order from January (n=12); this is a small-n fit by design — the underlying player-level sample sizes (7,566, 5,094, 2,472, 903) are what make each month's share a stable number to regress against.
Limits, stated plainly. Wikidata's NHL roster is not a random sample of everyone who has played in the league — well-documented eras and notable players are more likely to have a sourced birthdate than a replacement-level player from the league's early decades, and the 1879–2004 span this pulls mixes players who grew up under different (though generally similar) youth-hockey cutoff rules across a century. The population baseline is Canadian births only, while roughly a third of the roster holds non-Canadian citizenship (Sweden, Russia, Czechia, Finland, the U.S. and others), each with its own national birth-seasonality curve this run does not individually source — the Canadian baseline is used as the best-documented single proxy, not a perfect match for every player's home country. And this run measures a birth-month distribution, not a mechanism directly: it does not observe youth-league selection decisions, only the shape those decisions leave behind twenty-some years later in who reaches the NHL.
nhl_birth_months.csv (7,566 players) · canada_births_by_month.csv (34 years × 12 months) · fit output (JSON).
