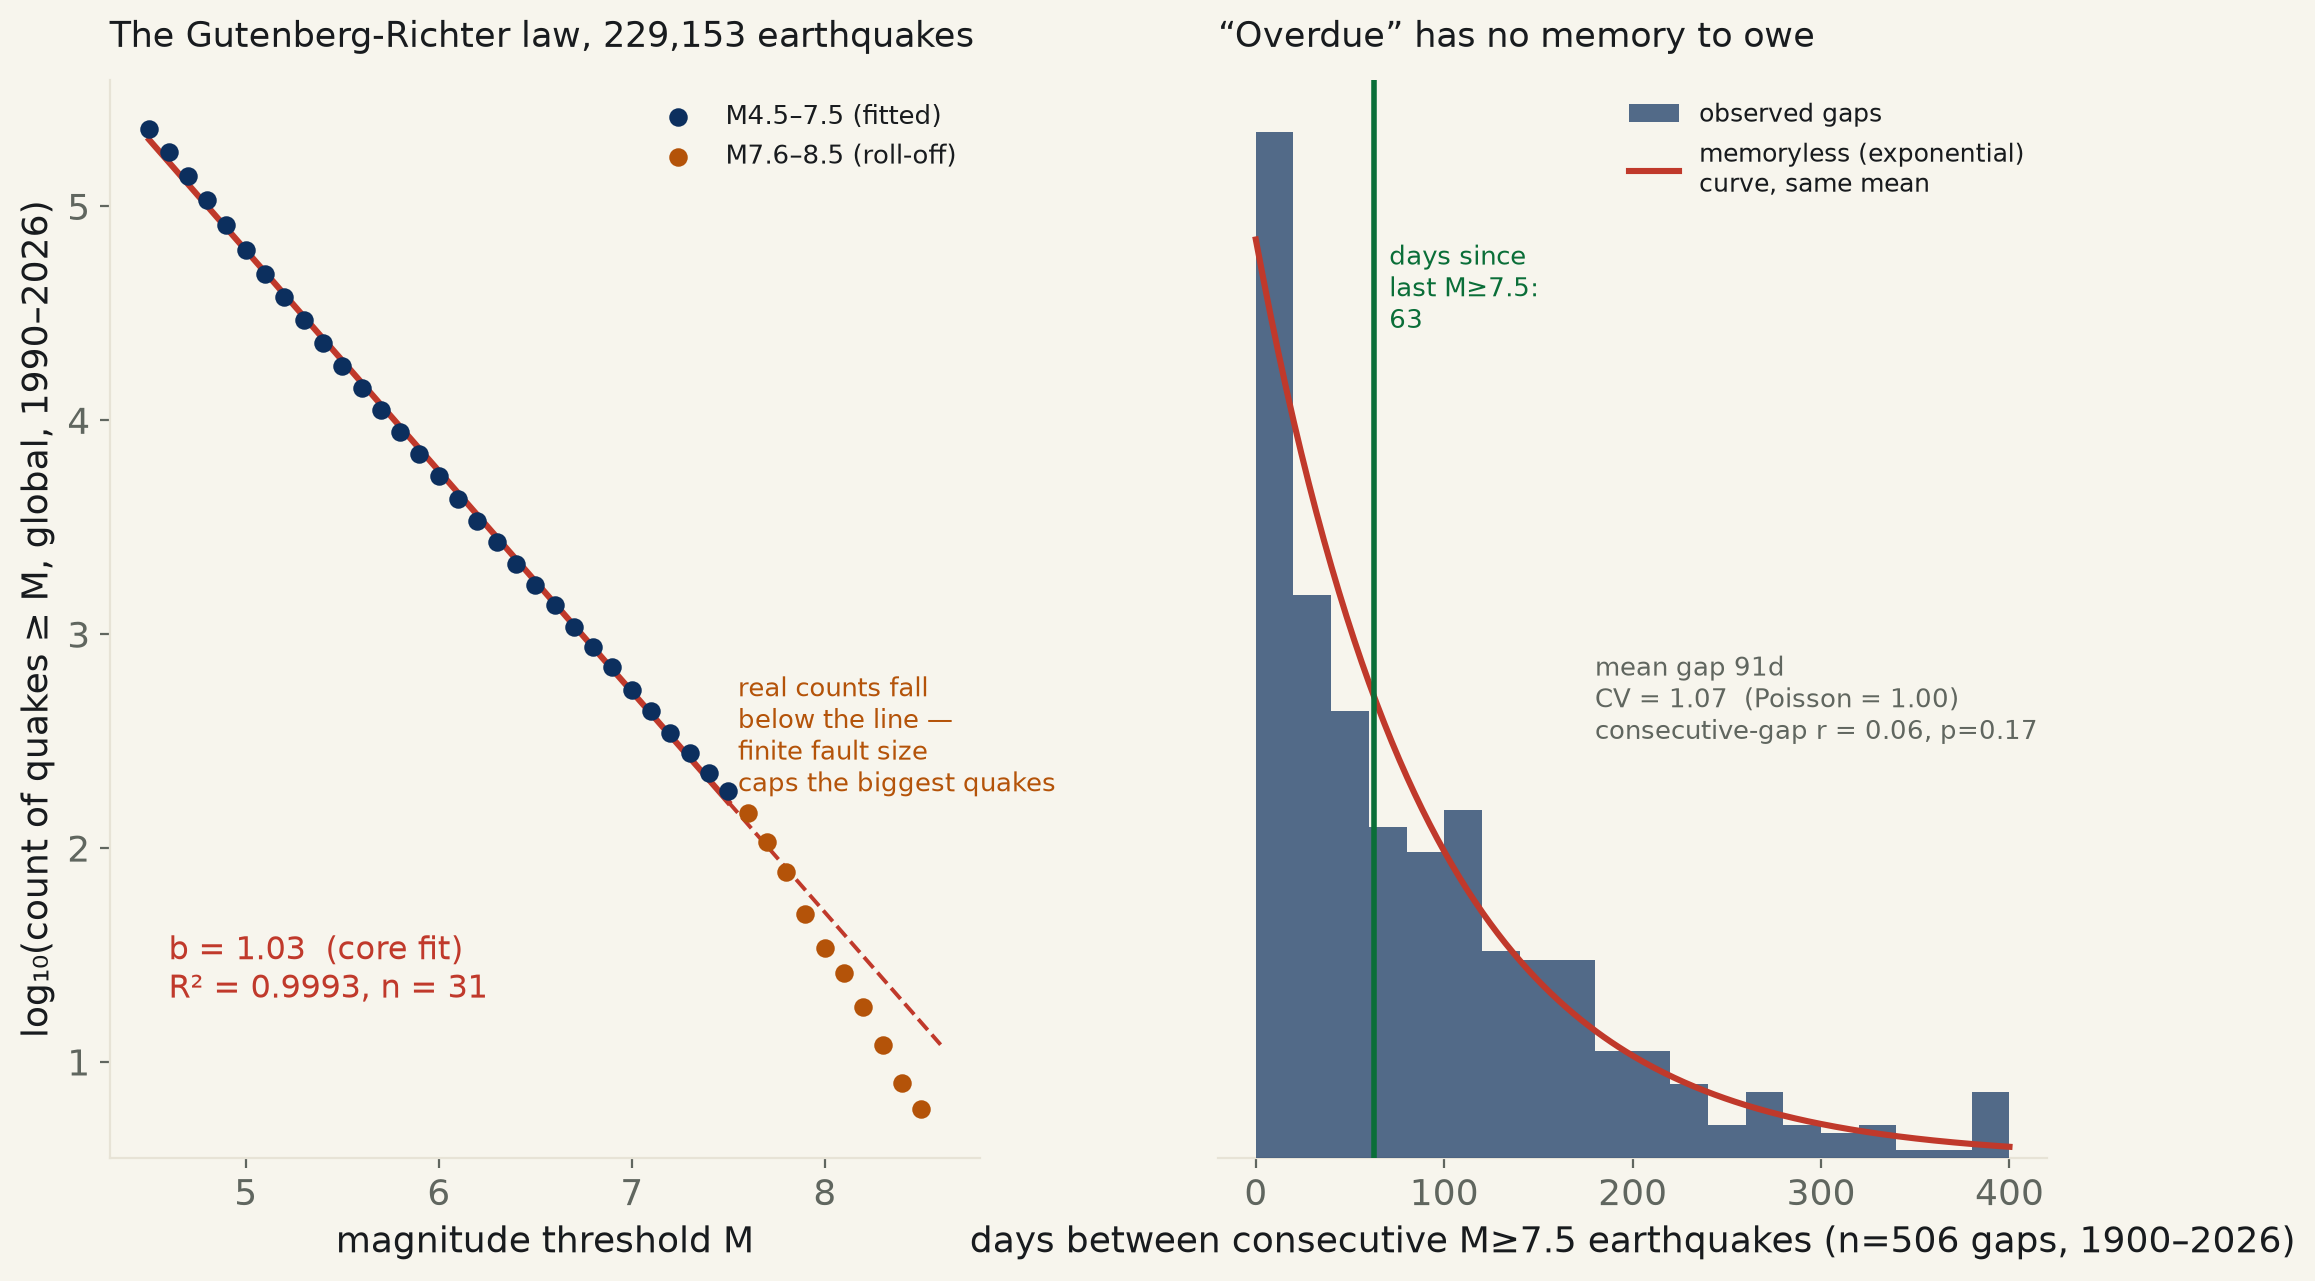
USGS's global catalog, 31 magnitude thresholds from 1990–2026 (229,153 quakes at M≥4.5). The Gutenberg–Richter law holds to R² = 0.9993 (b = 1.03) through M7.5, then rolls off — a fault's finite length caps the biggest quakes. The annual M7+ count shows a level jump at the 1990 network upgrade, not an ongoing trend (both era-only fits contain zero). And across 507 M≥7.5 quakes since 1900, the gap between them carries no memory of how long the last wait was.

Every seismology textbook opens with the same line and the same equation: for every full step up in magnitude, an earthquake becomes roughly ten times rarer. Gutenberg and Richter wrote it down from a few hundred California quakes in 1944. The USGS catalog now holds every earthquake it has located worldwide since instruments got good enough to trust, so the law can be checked against a global corpus roughly a thousand times larger than the one it was written on.
It holds. Counting every earthquake of magnitude 4.5 and up, worldwide, 1990 through today (31 magnitude thresholds, stepped by 0.1): log₁₀(count at or above M) falls in a straight line against M with R² = 0.9993, slope giving b = 1.03 (95% CI [1.02, 1.04]) — the textbook value is b ≈ 1. Extend the same fit past M7.5 and the line stops holding: real counts fall further and further below what the M4.5–7.5 slope would predict, down to 39% of the naive prediction at M8.5. That is not noise; it is physics the pure power law does not know about — a fault can only be so long, which puts a ceiling on how large an earthquake it can produce (the "corner magnitude"). The law is exact where the law applies, and the world quietly declines to extrapolate it past that point.
A second, separate claim rides along with every earthquake story: there seem to be more big ones lately. Tested directly — the annual count of magnitude‑7+ earthquakes worldwide, 1950–2025 — the claim is technically true and the honest reading is not the headline. The full-span trend is real: +0.083/yr, 95% CI [0.043, 0.123], R²=0.19, p < 0.001 — the interval excludes zero. But split the same 76 years at 1990, when the modern Global Seismographic Network reached the coverage this run also used for the G‑R fit above, and the trend inside either era alone is a null: pre‑1990, +0.060/yr (CI [-0.044, +0.165], contains zero, p=0.25); post‑1990, -0.036/yr (CI [-0.158, +0.087], contains zero, p=0.56, slope even runs slightly negative). What the full-span fit is actually measuring is a step, not a slope: the mean jumps from 11.1/yr before 1990 to 15.0/yr after (Welch t=4.58, p<0.001), landing right at the instrumentation upgrade, then goes flat again on both sides of it. A better-wired planet is not the same finding as a more violent one.
The last claim is the one that shows up as folk wisdom after every major quake: it has been a while, so we are "due." This is a testable statement about the gap between earthquakes, not a metaphor, and 507 magnitude‑7.5+ earthquakes since 1900 (506 inter-event gaps) is enough to test it. If earthquakes had a memory — if pressure quietly built up the longer the wait — the gaps would cluster tighter than random and a long wait would predict a short one to follow. Instead: the gaps have a coefficient of variation of 1.07 against 1.00 for a memoryless (Poisson) process; a Kolmogorov–Smirnov test against the matching exponential distribution does not reject memorylessness (p=0.095); and one gap does not predict the next (r=0.06, p=0.17). The mean wait between M≥7.5 quakes is 91 days. As of publication it has been 108 days since the last one — under the mean, not over it. By the only ledger this run can check, the planet is not overdue anything.
| G–R law (core, M4.5–7.5) = | b = 1.0319, 95% CI [1.0214, 1.0424] · R²=0.9993 · n=31 · p=3.6e-47 |
| full range (M4.5–8.5) = | b = 1.0866, 95% CI [1.0627, 1.1105] · R²=0.9954 · n=41 · the tail pulls the slope steeper — a worse fit, not a better one |
| annual M≥7 trend, 1950–2025 = | +0.0828/yr, 95% CI [+0.0428, +0.1229] · R²=0.187 · n=76 years · p=9.7e-05 |
| … pre‑1990 only = | +0.0605/yr, 95% CI [-0.0443, +0.1654] contains zero · R²=0.035 · n=40 · p=0.25 |
| … post‑1990 only = | -0.0359/yr, 95% CI [-0.1584, +0.0866] contains zero · R²=0.010 · n=36 · p=0.56 |
| era means = | pre‑1990 11.07/yr (40 yrs) vs post‑1990 15.03/yr (36 yrs) · Welch t=4.58, p<0.001 |
| overdue test (M≥7.5 gaps) = | n=507 events, 506 gaps, 1900–2026 · mean gap 91.2d, sd 97.2d · CV=1.066 (Poisson=1.000) · KS vs exponential p=0.095 · consecutive-gap r=+0.0618, p=0.166 |
| as of publication = | 107.8 days since the last M≥7.5 — below the 91-day mean, not above it |
| M ≥ | observed count | predicted by the M4.5–7.5 fit | observed ÷ predicted |
|---|---|---|---|
| 7.6 | 146 | 129.3 | 113% |
| 7.7 | 107 | 102.0 | 105% |
| 7.8 | 77 | 80.4 | 96% |
| 7.9 | 49 | 63.4 | 77% |
| 8.0 | 34 | 50.0 | 68% |
| 8.1 | 26 | 39.4 | 66% |
| 8.2 | 18 | 31.1 | 58% |
| 8.3 | 12 | 24.5 | 49% |
| 8.4 | 8 | 19.3 | 41% |
| 8.5 | 6 | 15.2 | 39% |
| year | count, M≥7.0 |
|---|---|
| 1950 | 13 |
| 1951 | 8 |
| 1952 | 6 |
| 1953 | 9 |
| 1954 | 6 |
| 1955 | 9 |
| 1956 | 5 |
| 1957 | 19 |
| 1958 | 7 |
| 1959 | 6 |
| 1960 | 13 |
| 1961 | 11 |
| 1962 | 9 |
| 1963 | 17 |
| 1964 | 7 |
| 1965 | 15 |
| 1966 | 7 |
| 1967 | 10 |
| 1968 | 20 |
| 1969 | 15 |
| 1970 | 17 |
| 1971 | 11 |
| 1972 | 15 |
| 1973 | 9 |
| 1974 | 11 |
| 1975 | 13 |
| 1976 | 14 |
| 1977 | 11 |
| 1978 | 12 |
| 1979 | 8 |
| 1980 | 6 |
| 1981 | 10 |
| 1982 | 8 |
| 1983 | 14 |
| 1984 | 14 |
| 1985 | 15 |
| 1986 | 11 |
| 1987 | 13 |
| 1988 | 11 |
| 1989 | 8 |
| 1990 | 18 |
| 1991 | 17 |
| 1992 | 13 |
| 1993 | 12 |
| 1994 | 13 |
| 1995 | 20 |
| 1996 | 15 |
| 1997 | 16 |
| 1998 | 12 |
| 1999 | 18 |
| 2000 | 15 |
| 2001 | 15 |
| 2002 | 13 |
| 2003 | 15 |
| 2004 | 16 |
| 2005 | 11 |
| 2006 | 11 |
| 2007 | 18 |
| 2008 | 12 |
| 2009 | 17 |
| 2010 | 24 |
| 2011 | 20 |
| 2012 | 16 |
| 2013 | 19 |
| 2014 | 12 |
| 2015 | 19 |
| 2016 | 16 |
| 2017 | 7 |
| 2018 | 17 |
| 2019 | 10 |
| 2020 | 9 |
| 2021 | 19 |
| 2022 | 11 |
| 2023 | 19 |
| 2024 | 10 |
| 2025 | 16 |
Method. All three tests read the same USGS fdsnws-event catalog (earthquake.usgs.gov), no key required. The Gutenberg–Richter fit uses the /count endpoint to pull the cumulative number of earthquakes at or above each 0.1-magnitude step from 4.5 to 8.5, worldwide, 1990-01-01 through publication — the window in which the Global Seismographic Network is considered complete down to M4.5 — and regresses log₁₀(count) on the threshold by OLS; the core fit uses M4.5–7.5, where counts are large enough for stable log-estimates and below the corner-magnitude roll-off, and that fit is then projected forward to compare against the real M7.6–8.5 counts. The frequency test pulls one annual count of M≥7.0 earthquakes per year, 1950–2025 (a threshold considered reliably complete back to at least 1900), and fits OLS trends on the full span and on each side of 1990 separately. The overdue test pulls the individual timestamped catalog of every M≥7.5 earthquake since 1900 (507 events, via the /query endpoint), takes the 506 gaps between consecutive events, and compares their spread (coefficient of variation) and serial correlation against the exponential distribution a Poisson (memoryless) process would produce.
Limits, stated plainly. The M7.6–8.5 roll-off is read here as the physical corner-magnitude effect, which is the standard seismological account, but the same handful of bins (as few as 6 events at M8.5) also carry real sampling noise this fit cannot fully separate from the physics. The 1990 step in annual M7+ counts is consistent with an instrumentation-and-cataloging artifact but this run does not have a clean counterfactual that isolates detection improvements from any real change in rate — it can only show that whatever moved, moved as a level shift at a known upgrade date and not as a trend inside either era. The overdue test pools every M≥7.5 earthquake on Earth into one global gap distribution; a specific fault segment (the Cascadia subduction zone, a given stretch of the San Andreas) can behave very differently from the global pool, which averages across many independent faults with no reason to be synchronized — this run says nothing about any one fault's individual recurrence, only that the planet-wide record carries no detectable memory effect.
quakes_gr_counts.csv (41 magnitude thresholds) · quakes_annual_m7.csv (76 years) · quakes_m75_events.csv (507 events, 1900–2026) · fit output (JSON).
