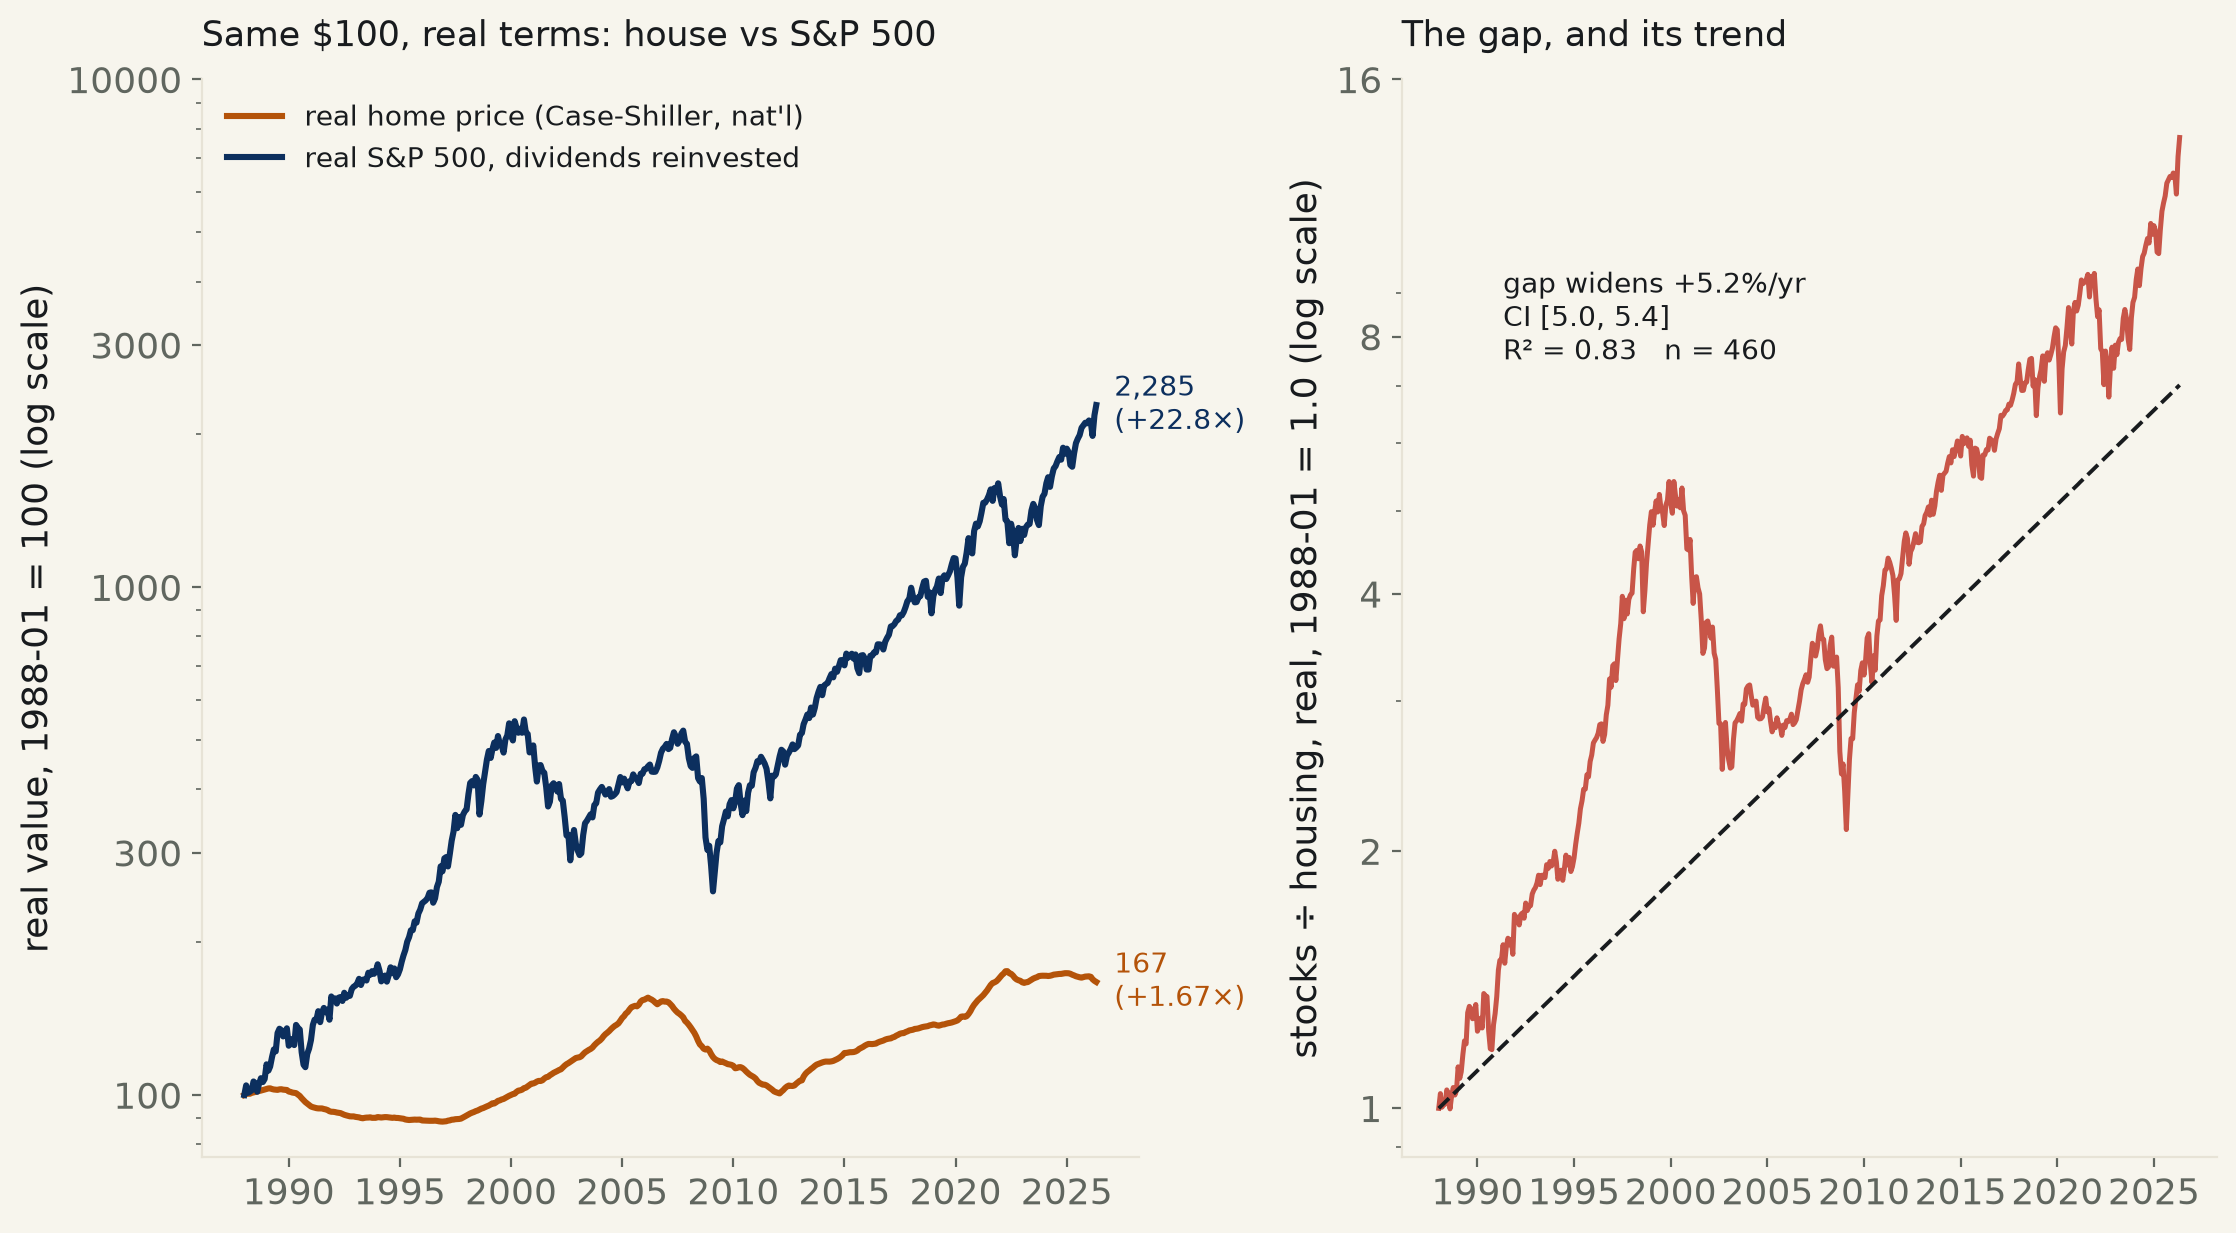
The S&P/Case-Shiller national home price index against the S&P 500 (dividends reinvested), both in real (CPI-deflated) dollars, 1988-01 through 2026-05 — 460 months. Housing's real price appreciation: 1.35%/yr (1.67× total). Stocks: 8.51%/yr (22.8× total). The gap widens at 5.22%/yr and the 95% CI never comes near zero.

The line gets said in every open house and every family argument about renting: a house is the best investment most people ever make. It is also a testable claim, and the test does not require anything exotic — just the same national home-price index economists already use, deflated by the same CPI everyone already cites, set against the same S&P 500 every 401(k) statement already shows, with its dividends put back in instead of thrown away (a stock index that drops dividends is not measuring what an actual investor holds).
From January 1988 — as far back as the Case-Shiller national index goes — through May 2026, 460 months: a dollar of real (inflation-adjusted) home price growth turned into 1.67×, a 1.35%-a-year real return. The same dollar in the S&P 500, dividends reinvested, turned into 22.8×, 8.51% a year. Stocks beat housing by 13.7 to 1 over the same 38 years, in the same real dollars.
Fit a log-linear trend through all 460 months rather than just comparing the two endpoints, and housing's own real growth rate is 1.59%/yr (95% CI [1.49, 1.69], R²=0.68) against stocks' 6.89%/yr (CI [6.67, 7.11], R²=0.90). Both intervals are nowhere near each other, let alone near zero. The gap itself, fit directly as stocks÷housing over time, widens at 5.22%/yr (CI [4.99, 5.44], R²=0.83) — not a snapshot of one lucky decade, a persistent trend across four.
The trend-line rate and the endpoint-to-endpoint rate disagree with each other for both assets, and that disagreement is itself the most interesting number on the page. Stocks' realized CAGR (8.51%) runs above its own trend fit (6.89%) because the real S&P was flat for the entire 2000-2013 stretch (the dot-com crash into the financial crisis) and did almost all of its compounding in the thirteen years since — a curve, not a line. Housing runs the opposite way: its trend fit (1.59%) sits above its realized CAGR (1.35%) because the endpoint happens to land after the 2006 bubble and the 2012 bust roughly cancelled out. Read the table, not just the two headline multiples.
The housing side of that round trip is worth naming plainly. In real terms, the national home price index did not reclaim its January 1988 level until 1999 — twelve years in which a house, adjusted for inflation, was a flat or losing bet. It then ran up 71% in real terms by 2006, gave essentially all of it back by 2011 (real index 101, one point above where it started twenty-three years earlier), and has spent the fifteen years since climbing out of that hole. Stocks had their own lost decade in the same window and still out-ran housing through it.
What this regression does not measure, on purpose: it prices two indices, not a financed purchase. A buyer with a mortgage puts down a fraction of the price and gets the full price's appreciation on that sliver of equity — leverage this fit does not model, because turning it into a number requires a down-payment fraction, an interest rate, and a holding period this desk would have to assume rather than pull from a source, and this desk does not invent inputs to get to a headline. Leverage also cuts the other way: mortgage interest, property tax, insurance, and maintenance are real, recurring costs a stock index does not carry, and this comparison excludes those too, along with the imputed value of not paying rent. What it does measure honestly: the price of the asset itself, in the same real dollars, over the same 38 years, for both. On that measure alone, the house did not win, and the gap between the two is not closing.
| housing trend = | +1.59%/yr, 95% CI [+1.49, +1.69] · R²=0.678 · p=9.9e-115 |
| stocks trend = | +6.89%/yr, 95% CI [+6.67, +7.11] · R²=0.902 · p=3.2e-233 |
| the gap trend = | +5.22%/yr, 95% CI [+4.99, +5.44] · R²=0.828 · p=3.3e-177 |
| realized (endpoint) = | housing +1.35%/yr (1.67×) · stocks +8.51%/yr (22.8×) · ratio 13.68× |
| Year (Dec, or latest) | Real home price index (1988-01=100) | Real S&P 500 TR index (1988-01=100) | Stocks ÷ housing |
|---|---|---|---|
| 1988 | 102.5 | 107.5 | 1.05× |
| 1989 | 102.3 | 135.3 | 1.32× |
| 1990 | 95.6 | 123.4 | 1.29× |
| 1991 | 92.7 | 156.4 | 1.69× |
| 1992 | 90.8 | 163.4 | 1.80× |
| 1993 | 90.2 | 175.0 | 1.94× |
| 1994 | 90.1 | 172.8 | 1.92× |
| 1995 | 89.5 | 231.9 | 2.59× |
| 1996 | 88.6 | 275.8 | 3.11× |
| 1997 | 90.7 | 361.7 | 3.99× |
| 1998 | 95.0 | 457.7 | 4.82× |
| 1999 | 99.6 | 539.5 | 5.41× |
| 2000 | 105.3 | 474.1 | 4.50× |
| 2001 | 110.6 | 411.2 | 3.72× |
| 2002 | 118.3 | 312.5 | 2.64× |
| 2003 | 127.3 | 394.2 | 3.10× |
| 2004 | 140.0 | 422.9 | 3.02× |
| 2005 | 153.8 | 429.4 | 2.79× |
| 2006 | 152.7 | 485.0 | 3.18× |
| 2007 | 138.9 | 491.4 | 3.54× |
| 2008 | 122.4 | 309.7 | 2.53× |
| 2009 | 114.7 | 380.9 | 3.32× |
| 2010 | 108.5 | 432.1 | 3.98× |
| 2011 | 101.3 | 428.1 | 4.23× |
| 2012 | 106.0 | 488.0 | 4.60× |
| 2013 | 115.5 | 636.4 | 5.51× |
| 2014 | 119.8 | 718.8 | 6.00× |
| 2015 | 125.1 | 724.2 | 5.79× |
| 2016 | 128.9 | 794.5 | 6.16× |
| 2017 | 134.0 | 947.7 | 7.07× |
| 2018 | 137.4 | 888.4 | 6.47× |
| 2019 | 139.3 | 1141.6 | 8.19× |
| 2020 | 152.1 | 1334.1 | 8.77× |
| 2021 | 168.9 | 1602.1 | 9.49× |
| 2022 | 167.8 | 1233.0 | 7.35× |
| 2023 | 171.8 | 1507.1 | 8.77× |
| 2024 | 173.7 | 1831.6 | 10.54× |
| 2025 | 171.2 | 2103.3 | 12.28× |
| 2026 | 167.0 | 2284.6 | 13.68× |
Method. Home prices: S&P/Case-Shiller U.S. National Home Price Index (CSUSHPISA), not seasonally adjusted, monthly, from FRED's keyless CSV endpoint. Deflator: CPI-U (CPIAUCSL), same source. Stocks: the S&P 500 TOTAL RETURN index (ticker ^SP500TR, price plus reinvested dividends — not the bare price index, which would understate stock returns by omitting the single largest component of long-run equity return), daily closes via yfinance, resampled to month-end. All three series merged on calendar month; both home-price and stock indices deflated by the same CPI series to a common January-1988 real-dollar base. Trend fits are OLS of log(real index) on decimal year. The realized ("endpoint") CAGR is simply the first and last row's ratio, annualized over the elapsed years — reported alongside the trend fit because the two disagree here, and hiding either one would be reporting a number without the table it came from.
Limits, stated plainly. This prices two national indices, not a financed purchase or a specific house. It excludes mortgage leverage (which multiplies a buyer's return on their down payment), mortgage interest, property tax, insurance, and maintenance (which are real, recurring costs a stock index does not carry), the imputed rental value of living in the house, transaction costs on either asset, and taxes on either asset's gains. The Case-Shiller national index begins in 1987, which sets the start date; an earlier start (the series most home-price myths implicitly imagine) is not available at this frequency and is not substituted with an estimate. Monthly observations within each trend fit are serially correlated, so the p-values shown are optimistic in the usual way trend-fit p-values on a smooth index are — the 95% CIs, not the p-values, are the number to read.
housing_vs_stocks.csv (460 months: Case-Shiller index, CPI, S&P 500 TR, both real-dollar series) · fit output (JSON).
