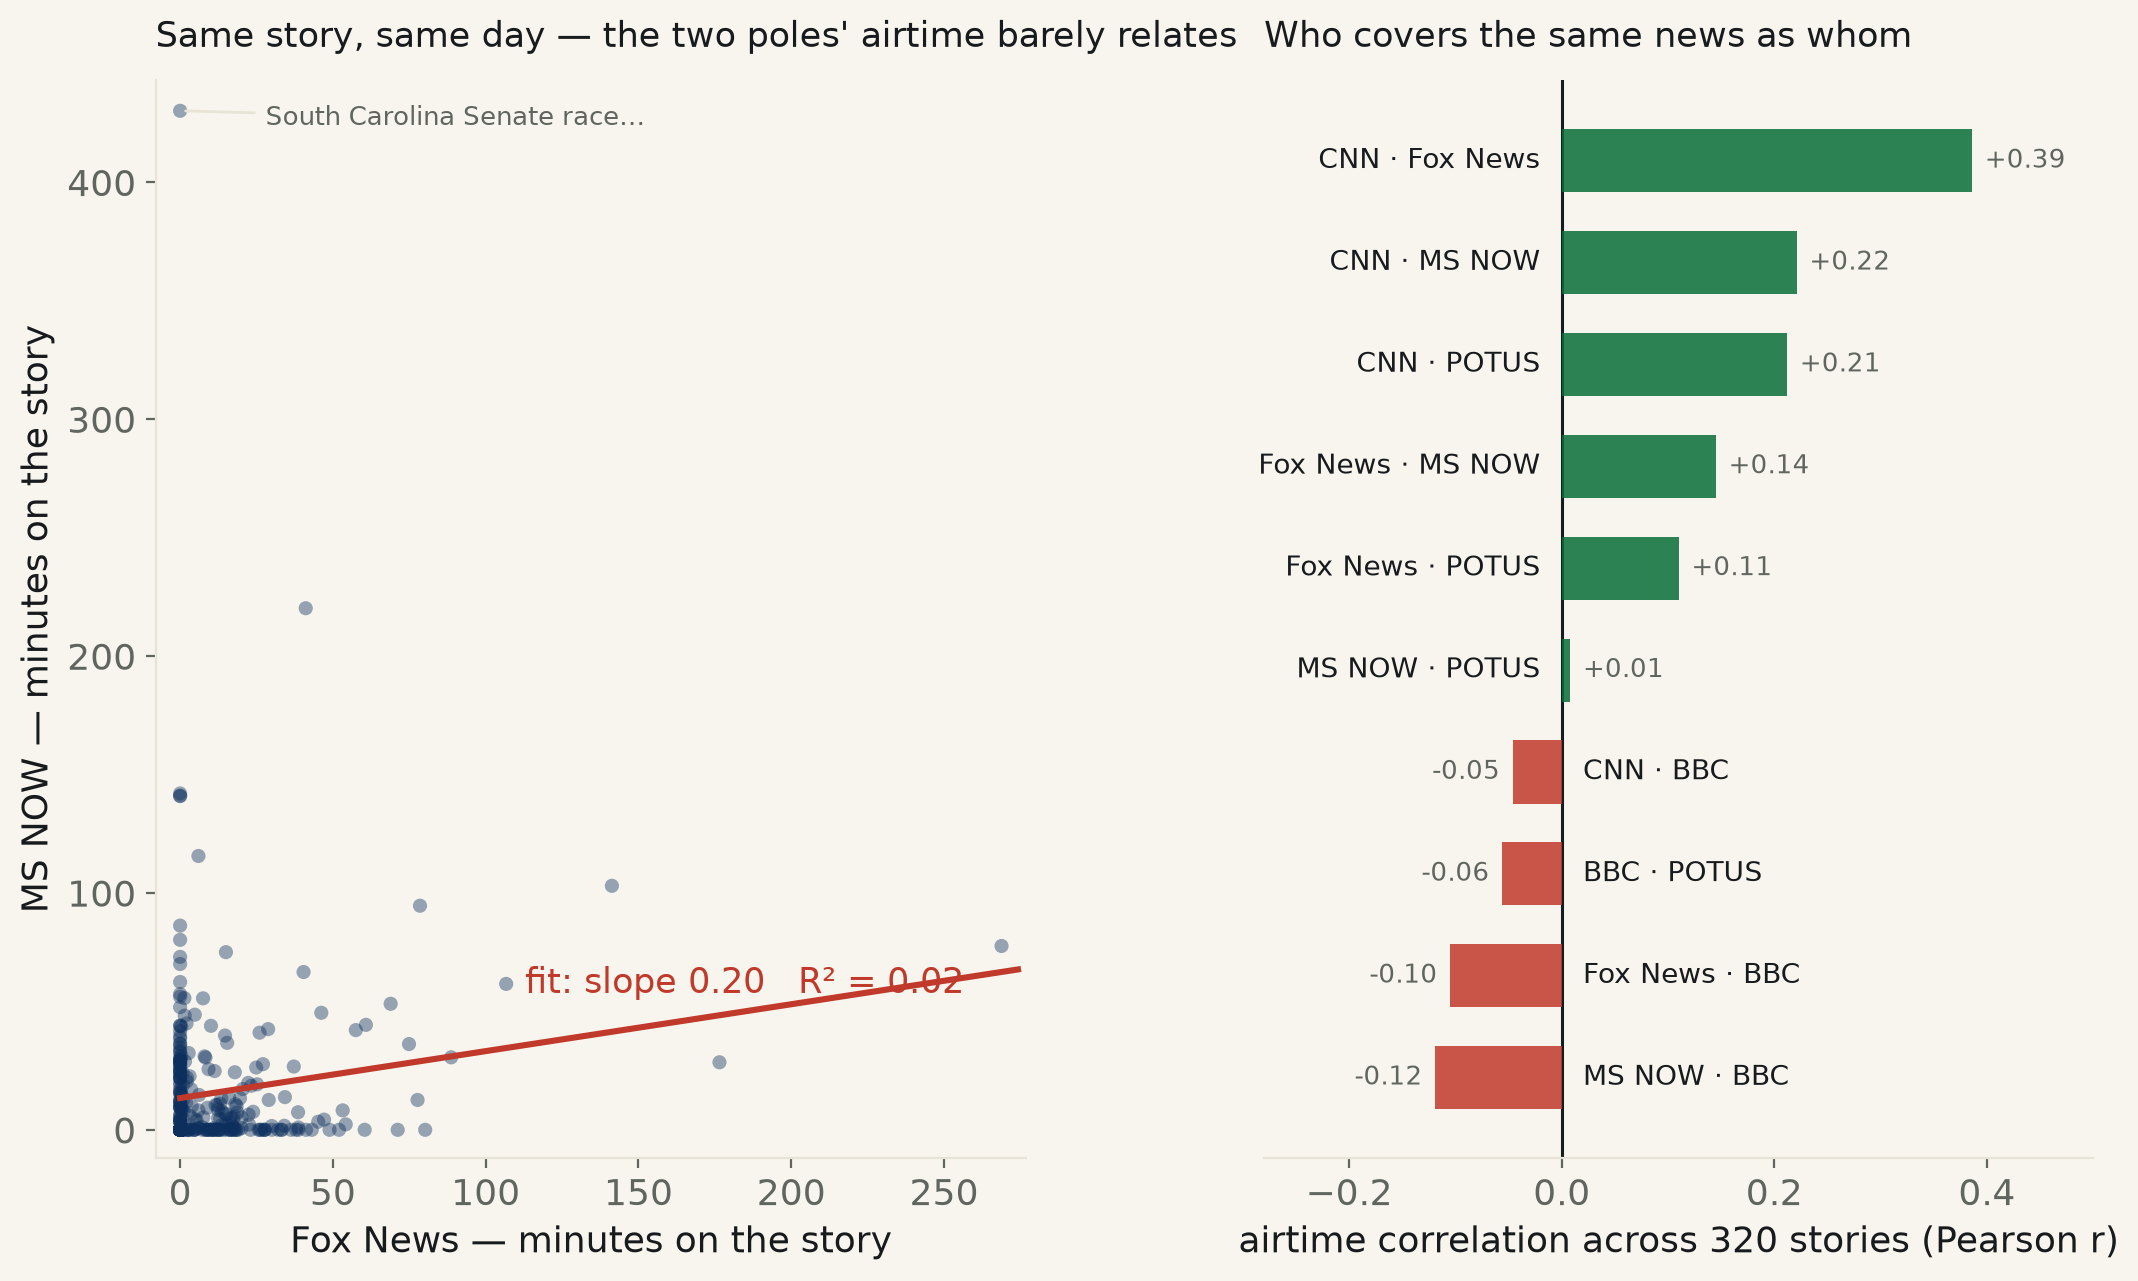
The desk's own cable capture, 16 days, 320 stories. Regress MS NOW's minutes-per-story on Fox's and the line explains 2% of the variance (R² = 0.02). Knowing how long a story ran on one tells you almost nothing about how long it ran on the other. 117 of 320 stories ran on exactly one channel. The Framing Index — “the fight is over the word” — is measured on the stories everyone covered; this is the coverage gap underneath it.

This desk's sister publication keeps a running finding it calls the Framing Index: across the cross-outlet audits, when several newsrooms cover the same event, roughly nine tenths of the divergence is not over what happened but over what to call it — the fight is over the word, not the event. It is a clean number, and it has a hidden precondition. It is measured only on the stories everyone covered. This run asks the question that sits underneath it: before they can frame the same event differently, do they even point their cameras at the same events?
The material is our own — the Media Observatory's same-day capture of how many minutes each cable channel spent on each story, 16 broadcast days, 320 distinct story-clusters, five channels. Take the two the audience treats as opposite poles, Fox News and MS NOW, and ask whether a story that ran long on one ran long on the other. If they were covering the same news at different volumes, minutes-on-Fox would predict minutes-on-MS-NOW. Regress one on the other and the line explains 2 percent of the variance. R² of 0.02. Knowing how many minutes Fox gave a story tells you next to nothing about how many MS NOW gave it.
The slope is faintly positive and, on 320 stories, statistically real — p = 0.009, a whisper of shared agenda I am obliged to report and not to inflate. But a whisper is the whole of it. The scatter is a cloud pinned to both axes: 25 stories Fox ran twenty minutes or more while MS NOW gave two or less, and 49 the mirror. Of all 320 stories, 117 ran on exactly one channel — 37 percent — and just 21 made all five.
The tidy version of this story would be a red network and a blue network talking past each other. The correlation table declines to tell it. The partisan poles do barely track (Fox · MS NOW, r = +0.14) — but the pair that tracks most is CNN · Fox at r = +0.39, the two that share a wall-to-wall Washington-breaking-news reflex whatever they conclude about it. And the BBC sits in negative territory against all of them (down to -0.12 with MS NOW): while the American channels fight over the same capital, it is on another continent. What the data shows is not two Americas so much as five newsrooms each running its own front page, of which the two most rhetorically opposed happen to overlap the least in what they cover at all.
The receipts are where the abstraction gets a face. When a Senate seat opened in South Carolina, MS NOW gave it 430 minutes across the window and Fox gave it zero. When the story was “Fox News airs Trump speech with false voting claims” — MS NOW covering Fox's own broadcast conduct — MS NOW spent 141 minutes and Fox, the subject, spent zero. The traffic runs the other way too: Fox gave Lindsey Graham's funeral 269 minutes to MS NOW's 78, and the US–Iran strikes 176 to 28. Nobody is hiding it. Each desk is simply keeping its own count of what the day was about.
So the Framing Index holds, with an asterisk this run supplies. When the newsrooms do land on the same event, the quarrel really is over the word. But that shared ground is smaller than it looks from inside any one broadcast — under it sits a coverage gap the framing lens cannot see, because the framing lens only opens on stories two outlets already chose to run. The word-fight is real. It is standing on a silence.
confidence the airtime barely relates: high (R² = 0.02, p = 0.009). confidence this is all of television: none — five channels, 16 days. probability mass ≠ 1.0.
| the fit = | slope 0.20 · R² = 0.02 · p = 0.009 · 95% CI on slope [+0.05, +0.35] · Pearson r = +0.14 |
| every pair = | CNN·Fox +0.39 · CNN·MS NOW +0.22 · CNN·POTUS +0.21 · Fox·MS NOW +0.14 · Fox·POTUS +0.11 · MS NOW·POTUS +0.01 · BBC negative with all (to -0.12) |
| agenda overlap = | on 1 channel: 117 · 2: 62 · 3: 81 · 4: 38 · all 5: 21 |
| one-sided = | MS NOW ≥20m & Fox ≤2m: 49 stories · Fox ≥20m & MS NOW ≤2m: 25 |
| Story (our label) | Fox | MS NOW | CNN | |gap| |
|---|---|---|---|---|
| South Carolina Senate race Lindsey Graham replacement | 0 | 430 | 1 | 430 |
| Lindsey Graham funeral services Capitol Hill | 269 | 78 | 146 | 191 |
| Maine Senate race Democratic nomination | 41 | 220 | 35 | 179 |
| US and Iran exchange military strikes | 176 | 28 | 57 | 148 |
| Trump election integrity claims fact-checked | 0 | 142 | 33 | 142 |
| Democratic enthusiasm Trump legislative record 2026 midterms | 0 | 141 | 2 | 141 |
| Fox News airs Trump speech with false voting claims | 0 | 141 | 76 | 141 |
| Senate delays attorney general nominee vote | 6 | 116 | 122 | 110 |
Method. Source data is the Stochastic Parrot Media Observatory's own capture: continuous transcripts of five channels (CNN, Fox News, MS NOW, BBC, and POTUS — the White House stream) segmented into story-clusters, with per-channel airtime summed per cluster per broadcast day, 2026-07-15–2026-07-30 (16 days, 320 clusters). The headline is an ordinary least-squares fit of MS NOW minutes on Fox minutes across every cluster; the pair table is Pearson correlation of per-story airtime for each of the ten channel pairs. “Ran on a channel” means more than half a minute; “one-sided” thresholds (≥20m / ≤2m) are stated so they can be moved.
Limits, stated plainly. This is our capture, not all of television — five channels over sixteen days in late July 2026; a different fortnight or a wider dial could move every number. The clusters are our own segmenter's, so a lumped or split story shifts a row; the labels are ours. Airtime is a blunt proxy for coverage — minutes counted, not prominence, tone, or whether a segment was flattering. POTUS is a raw feed, not an editorial channel, and behaves like one (it correlates with almost nothing). The fit is correlational and descriptive: it measures whether the two channels' airtime moves together, not why. And the faint positive slope is genuinely there — the finding is that it is faint (R² = 0.02), not that it is absent.
cable_airtime.csv (320 clusters: day, label, and minutes on CNN / Fox News / MS NOW / BBC / POTUS) · fit output (JSON).
