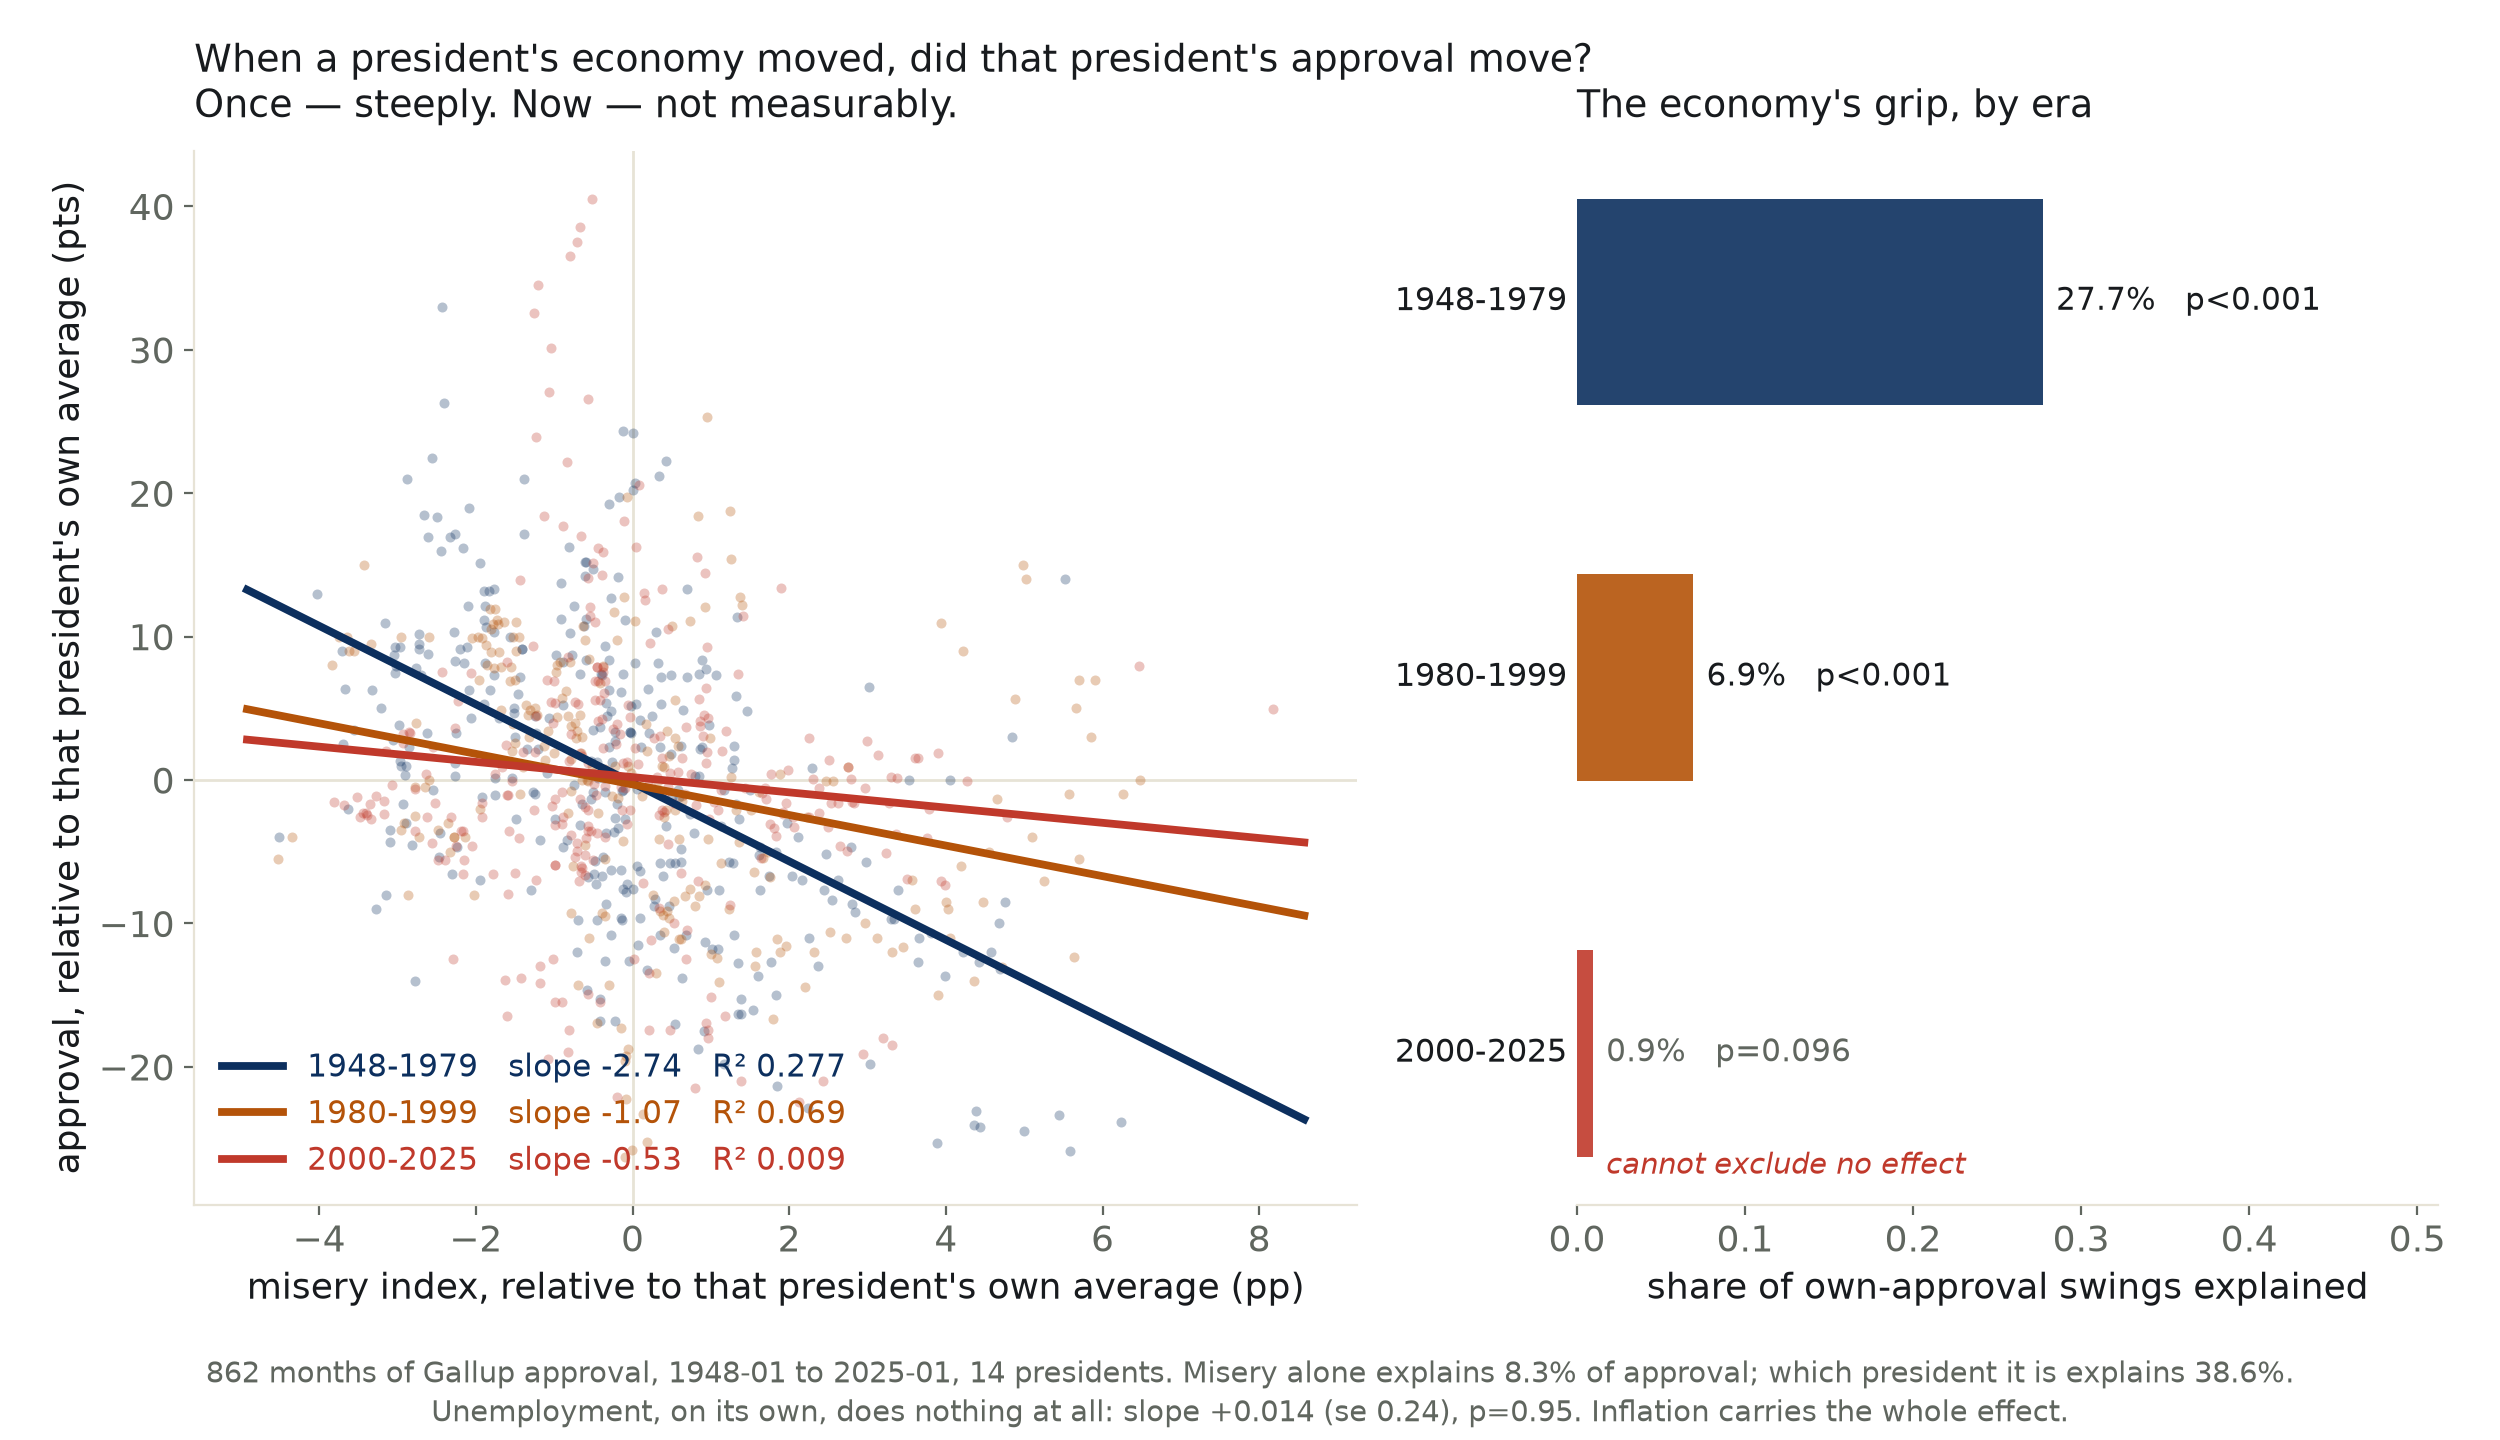
Across 862 months of Gallup approval and fourteen presidents, the misery index explains 8.3% of approval — and which president it is explains 38.6%. Unemployment on its own does nothing at all (slope +0.014, p = 0.95); inflation carries the entire effect. And within a single presidency the economy's grip has fallen from 27.7% before 1980 to 0.9% since 2000 — a fit that no longer excludes no effect.
The slogan is from a whiteboard in Little Rock in 1992, and it has outlived the campaign that wrote it. It is not a slogan about winning elections; that part is well evidenced. It is a claim about attention — that a public watching a president is really watching the economy, and that when the numbers move, the verdict moves with them.
That is a measurement claim, so we measured it. Gallup has asked the same approval question since 1937 — the only house that has — and the Bureau of Labor Statistics has kept unemployment and consumer prices since 1948. Take every month in which both exist, average the Gallup readings inside it so that a month of Obama daily tracking counts once and a month of Truman counts once, and you have 862 rows and fourteen presidents.
Regress approval on the misery index and the slope is real: each point of misery costs about a point of approval, and the interval does not go near zero. It also explains 8.3% of the variance. Ask the same table who the president is — nothing about the economy at all, just fourteen name tags — and that explains 38.6%. The name is worth four and a half times the numbers.
Then the misery index turns out to be two different things wearing one coat. Split it and inflation carries the whole load, at a point and a half of approval per point of prices. Unemployment carries none: slope +0.014, standard error 0.24, p = 0.95. Not small. Not weakly positive. Absent. Across seventy-seven years the share of Americans out of work has no detectable relationship with whether the country approves of the president, and the price of things has a large one.
The last cut is the one that changed what this run is about. Ask the narrow question — when this president's own economy moved, did this president's own approval follow — and then ask it separately by era. Before 1980 the answer is emphatically yes: a steep slope, 27.7% of the variance. In the eighties and nineties the slope halves and the variance share falls to 6.9%. Since 2000 the slope is −0.53 with a standard error of 0.32, p = 0.096, and an R² of 0.009.
That last line is a fit this desk does not get to call a finding. It cannot exclude no effect. Nine tenths of one percent is not a relationship; it is what is left when a relationship has gone.
Approval did not become calmer while this happened. Its standard deviation rose, from 9.9 points before 1980 to 13.3 since. Presidents' numbers move as much as they ever did. They have simply stopped moving with the economy, and the residuals say what they moved with instead: the three largest misses in the whole table are September 2001 (Bush at 90 where the economy predicted 54), March 1991 (Bush at 86 where it predicted 50), and February 1952 (Truman at 22 where it predicted 56). A war beginning, a war winning, and a war going badly with a scandal attached.
None of this says the economy stopped mattering to voters, and this desk cannot see a ballot. It says something narrower and, for a slogan, worse: the economy has stopped moving the number the slogan was written to move.
| the claim = | approval ~ misery: slope -1.077 pts per pp, 95% CI [-1.316, -0.838], R² = 0.083 — real, and small |
| unpooled = | unemployment +0.014 (p = 0.95, a null) · inflation -1.489 (p < 0.001) · R² = 0.112 |
| the name tag = | president fixed effects, no economics: R² = 0.386 · both together: 0.447 |
| within-president = | slope -1.546, R² = 0.099 · by era: 1948–79 -2.74 (R² 0.277) · 1980–99 -1.07 (R² 0.069) · 2000–25 -0.53 (R² 0.009, p = 0.096) |
| what moved instead = | 2001-09 George W. Bush approval 90 vs 54 predicted (+36) · 1991-03 George H.W. Bush 86 vs 50 (+36) · 1952-02 Harry S. Truman 22 vs 56 (-34) |
| and the spread = | approval standard deviation rose 9.9 → 13.3 points across the same eras — more movement, less of it economic |
Method. Approval is the Gallup series only, taken from a public compilation of 12,479 individual approval polls (1937–2025) and filtered to the Gallup Organization, because Gallup is the one house that has asked an identical question across the whole span; pooling all pollsters would let the modern era vote thirty times a month against Truman's once. Even inside Gallup the density is unequal — Obama's daily tracking is 1,077 polls against Reagan's 136 — so the unit of analysis is the calendar month, with all Gallup readings in a month averaged to one row. Unemployment (UNRATE) and consumer prices (CPIAUCSL, converted to year-over-year percent change) come from FRED's keyless CSV endpoint. Misery index = unemployment + inflation, the Okun definition. The within-president models subtract each president's own mean from both approval and misery, so no comparison is ever made across administrations; era splits are applied to those demeaned residuals. Ordinary least squares throughout, with conventional standard errors.
Limits, stated plainly. Fourteen presidents is the real sample; 862 months is the costume it wears, and months inside one presidency are not independent draws — the within-president design removes the between-president confound but does nothing about serial correlation, so the standard errors here are optimistic and the p = 0.096 on the modern era should be read as at least that far from significance, not as a near miss. Approval is not the vote; this run measures a poll question, and a president can lose the number and win the election or the reverse. FDR is excluded because the unemployment series starts in 1948. The record stops in January 2025, where the compilation ends, so the second Trump term is absent entirely. Misery weights a point of unemployment and a point of inflation equally, which the results themselves show is wrong — that is a finding here, not an assumption defended.
approval_economy.csv (862 months: president, party, months into term, Gallup approval, unemployment, inflation, misery) · fit output (JSON).
