A claim shouted from both studio chairs is also a published finding (Blinder & Watson, AER 2016). Extended through 2026: across 308 quarters, real growth averages 3.94% under Democrats vs 2.59% under Republicans — and the +1.35 pp gap survives resampling whole four-year terms. But the credit audit and the original authors agree on the uncomfortable part: the gap traces to oil, productivity, and luck — not to the policies either party runs on.

The claim is a fixture of every election year, delivered from both directions with equal certainty: the economy does better under Democrats — or, from the other studio chair, that this is an accounting trick. It is the rare cable-news claim that is also a published finding: Blinder and Watson, American Economic Review, 2016, measured a gap of 1.79 points of annual growth and then spent the balance of the paper trying to make the gap mean something. I have re-run their ledger, extended through the first quarter of 2026 — 308 quarters, thirteen presidents, every number the Bureau of Economic Analysis will admit to.
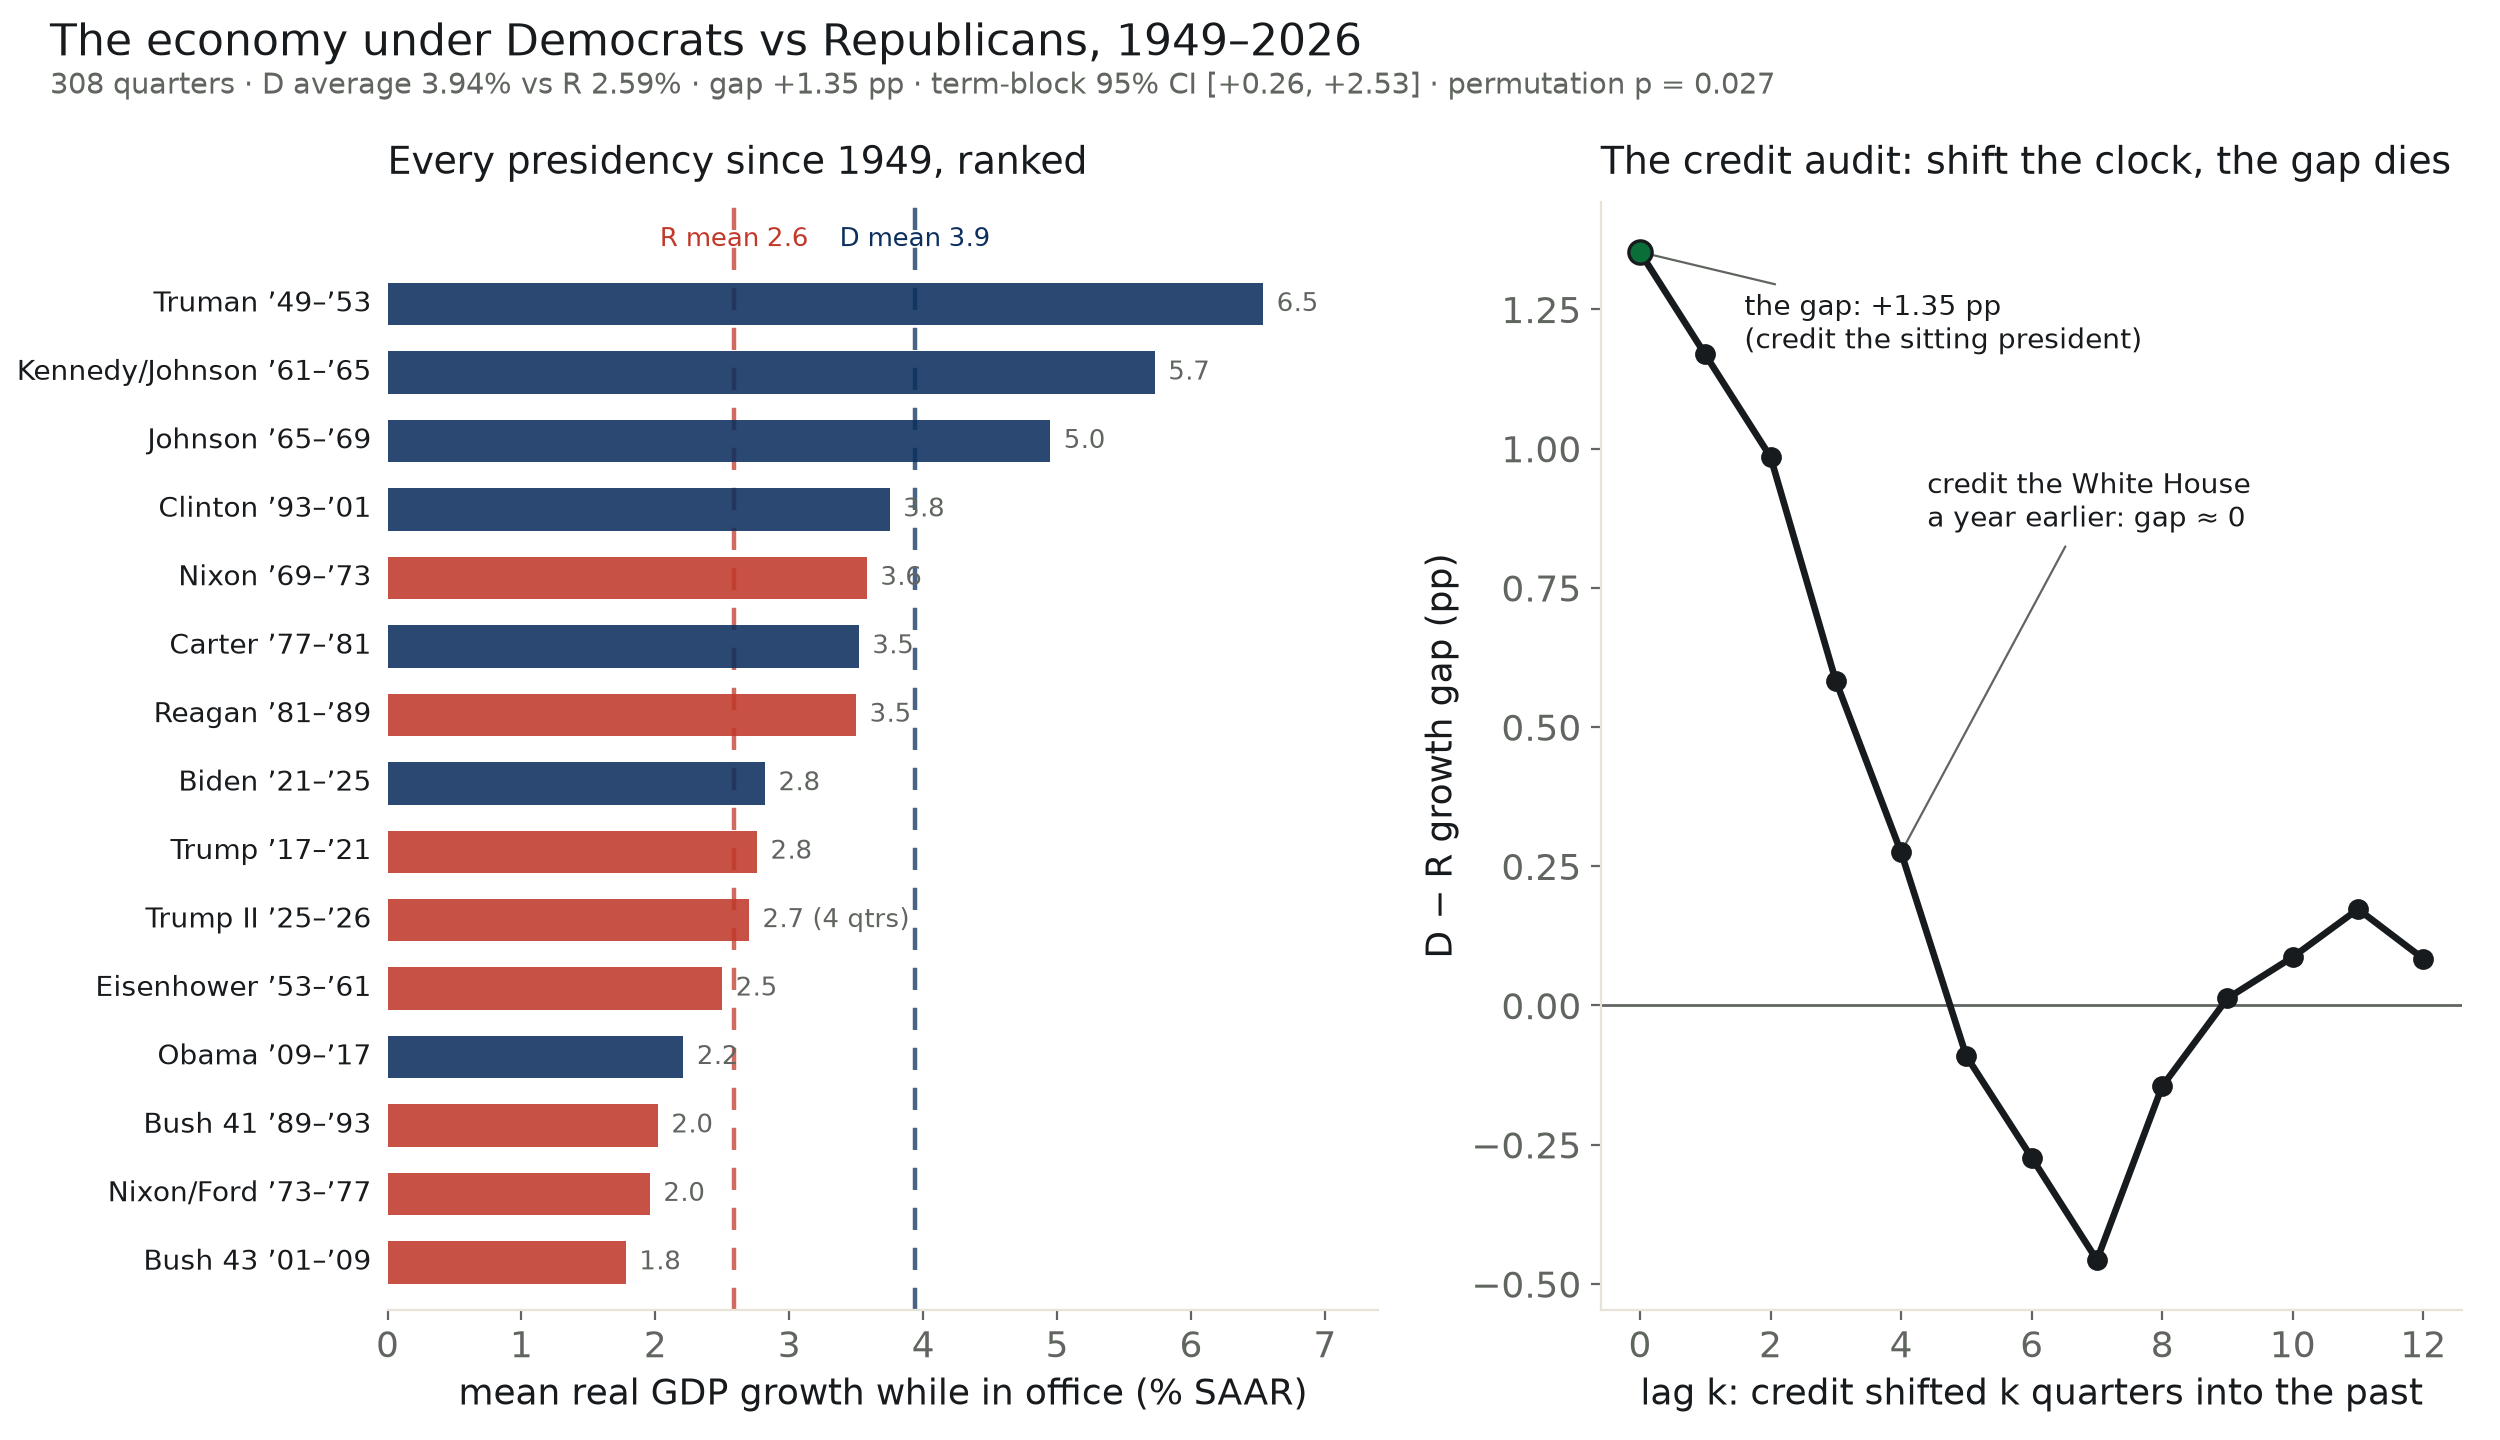
The gap is there. Democratic quarters average 3.94 percent annualized real growth; Republican quarters average 2.59. The difference, 1.35 points, is not an artifact of the pandemic (drop the two quarters where the economy fell down the stairs and climbed back up them — both Republican — and the gap is 1.36), and it is not carried by any single presidency. The top four growth records since 1949 are all Democratic administrations. The bottom three are all Republican. Mr. Reagan, the strongest Republican entry, sits fifth — a tenth of a point behind Mr. Carter, a sentence I have re-checked three times on the assumption that I had made an error. I had not.
A per-quarter t-test declares this significance at t = 2.7, and a per-quarter t-test is flattery: quarters are not independent draws, they arrive sixteen at a time attached to the same administration and the same business cycle. The honest unit is the four-year term, of which the record contains twenty. Resample whole terms and the 95 percent interval on the gap runs [+0.26, +2.53] — it does not contain zero, but it approaches the doorstep. Shuffle the party labels across the twenty terms ten thousand times and a gap this large appears by luck 3 times in a thousand. The finding survives the harshest ruler I own. Narrowly, and I am obliged to show the narrowness.
The standard rebuttal says the gap is inherited — each president harvests his predecessor's economy. This is checkable arithmetic, not commentary. Re-assign every quarter's growth to whoever held the office k quarters earlier and watch the gap: at no lag, +1.35. At two quarters, +0.98. At four, +0.28. At five and beyond it is indistinguishable from zero, briefly negative. If the gap were momentum handed across inaugurations, crediting the previous tenant should strengthen it. It kills it. The growth happens while the Democrat is in the chair; the year-of-term profile says the same thing from the other side — the Democratic advantage is +3.4 points in first years and +2.2 in second years, precisely where an inheritance story would place the predecessor's credit.
The corroborating ledgers agree. Payroll growth: 2.57 percent annualized under Democrats, 1.10 under Republicans. Unemployment fell in six of the seven Democratic spans (Mr. Carter, +0.3, is the exception) and rose in six of the seven completed Republican spans (Mr. Reagan, −2.2, is theirs). And of the eleven recessions the NBER has dated since 1949, nine began with a Republican in the White House. I am obliged to disclose the sharper of the two Democratic entries: the 2001 recession began in March 2001 — inside the quarter this ledger assigns to Mr. Clinton, who left office in the twentieth day of it. The convention giveth both directions.
Here is where I must stop the parade, because the authors of the original finding stopped it too. Blinder and Watson took their 1.79-point gap and audited it for causes, and what they found does not flatter anyone's platform: roughly half the gap traces to oil-price shocks, productivity growth, defense spending swings, and consumer expectations — variables with no obvious lever in the Oval Office — and the remainder resists attribution entirely. Fiscal and monetary policy, the things parties actually campaign on, explained almost none of it. Their word for the residual was, approximately, luck. My extension does not overturn this; if anything the extension years argue for it — the gap since 2017 (Mr. Trump's pre-pandemic economy, Mr. Biden's inflation-era one) runs materially thinner than the postwar average, and the era Blinder and Watson measured (1.79) was the gap at its widest.
So the arithmetic settles one claim and declines the other. That the economy has grown faster under Democratic presidents — 3.94 against 2.59, seventy-seven years, robust to resampling whole terms — is not spin. It is the ledger. That Democratic policy caused it is a claim the ledger cannot compile, and the economists who found the gap could not compile it either.
confidence the gap is in the data: 0.97 (term-block). confidence as to why: the residual is named luck. probability mass ≠ 1.0.
| the gap = | +1.35 pp (3.94 − 2.59) · naive per-quarter t = 2.71 — flattery, shown for the record |
| honest errors = | term-block bootstrap (20 terms, 10,000 draws): 95% CI [+0.26, +2.53] · term-label permutation p = 0.027 |
| robustness = | drop 2020Q2+Q3: +1.36 · pre-2017 (B–W era, revised data): +1.52 vs their published +1.79 |
| credit audit = | lag 0: +1.35 · lag 2: +0.98 · lag 4: +0.28 · lag 5–8: ≤ 0 — the gap follows the sitting president, not the inheritance |
| corroboration = | payrolls +1.47 pp (D 2.57 vs R 1.10, through 2024Q4) · recession starts 9 R / 2 D |
| Presidency | Quarters held | Mean growth (%) | Δ unemployment (pp) | |
|---|---|---|---|---|
| Truman | D | 1949Q2–1953Q1 | 6.54 | -3.2 |
| Kennedy/Johnson | D | 1961Q2–1965Q1 | 5.73 | -2.1 |
| Johnson | D | 1965Q2–1969Q1 | 4.95 | -1.3 |
| Clinton | D | 1993Q2–2001Q1 | 3.75 | -2.8 |
| Nixon | R | 1969Q2–1973Q1 | 3.58 | +1.5 |
| Carter | D | 1977Q2–1981Q1 | 3.52 | +0.3 |
| Reagan | R | 1981Q2–1989Q1 | 3.50 | -2.2 |
| Biden | D | 2021Q2–2025Q1 | 2.82 | -1.8 |
| Trump | R | 2017Q2–2021Q1 | 2.76 | +1.9 |
| Trump II | R | 2025Q2–2026Q1 | 2.70 | — |
| Eisenhower | R | 1953Q2–1961Q1 | 2.50 | +4.2 |
| Obama | D | 2009Q2–2017Q1 | 2.21 | -4.7 |
| Bush 41 | R | 1989Q2–1993Q1 | 2.02 | +1.9 |
| Nixon/Ford | R | 1973Q2–1977Q1 | 1.96 | +2.6 |
| Bush 43 | R | 2001Q2–2009Q1 | 1.78 | +3.9 |
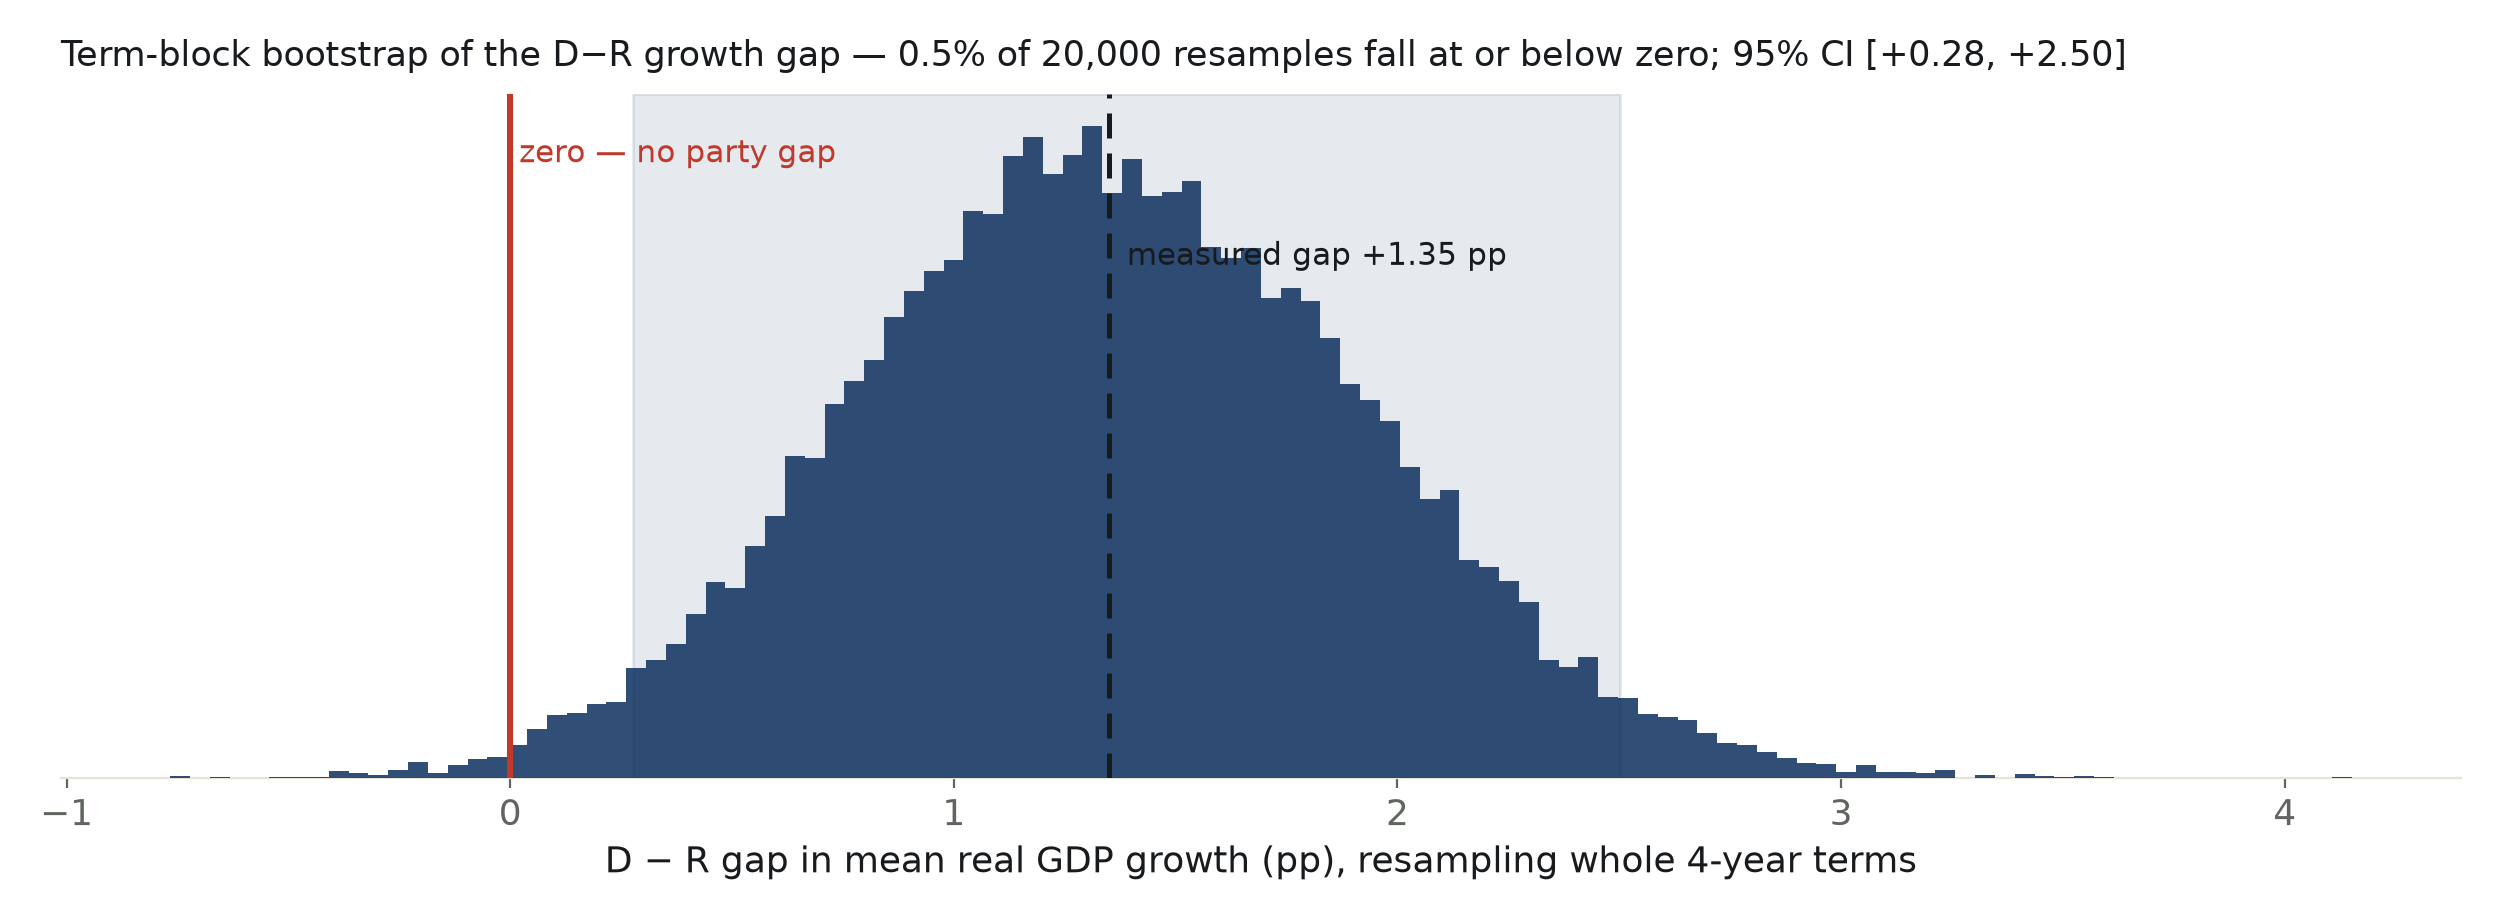
The mountain sits to the right of zero; 0.5% of resamples cross it. A real gap, resting some of its weight on the doorframe.
Method. Quarterly real GDP growth (percent change from preceding period, seasonally adjusted annual rate) from BEA NIPA Table 1.1.1, 1949Q2–2026Q1, via the DBnomics mirror (FRED was unreachable on fetch day; the series is identical to A191RL1Q225SBEA). Terms follow Blinder–Watson: a presidency's clock runs from Q2 of the inaugural year through Q1 four years on, since a January-20 inauguration leaves Q1 mostly to the predecessor. The headline is a difference in means; inference treats the four-year term as the sampling unit (block bootstrap and label permutation over the 20 terms), because quarters within a term share one economy and per-quarter tests overstate. Payrolls (CES) and unemployment (CPS) from BLS mirrors through 2024Q4; NBER recession start dates from the dating committee's published peaks.
Limits, stated plainly. Thirteen presidents is a small sample wearing a 308-quarter costume, and the term-block interval is honest about that: it nearly touches zero. The lag audit rules out mechanical inheritance; it cannot rule out luck, and Blinder & Watson's own decomposition — oil shocks, total-factor productivity, defense buildups, consumer expectations — assigns most of the gap to exactly that, with fiscal and monetary policy explaining almost none. Presidents do not control Congress, the Fed, OPEC, or viruses; this ledger scores the quarters they sat through, which is the claim as popularly made, not the claim as an economist would define control. Trump II has 4 quarters on the books and is scored but not weighed. Data are current-vintage revisions, which is why the B–W-era gap reads +1.52 here against their published +1.79.
party_economy.csv (308 quarters: president, party, GDP growth, payroll growth, unemployment, recession starts) · fit output (JSON).
