Scouts have drafted tall pitchers for a century — the “downhill plane,” the strikeouts that follow. Across 2,696 careers, era-adjusted: +0.02 points of K% per inch — nothing (the naive +0.89 was the calendar, not the anatomy). The height effect in baseball is real and lives at the other end: tall batters strike out +0.67 points per inch — the strike zone is drawn on the batter’s own body.

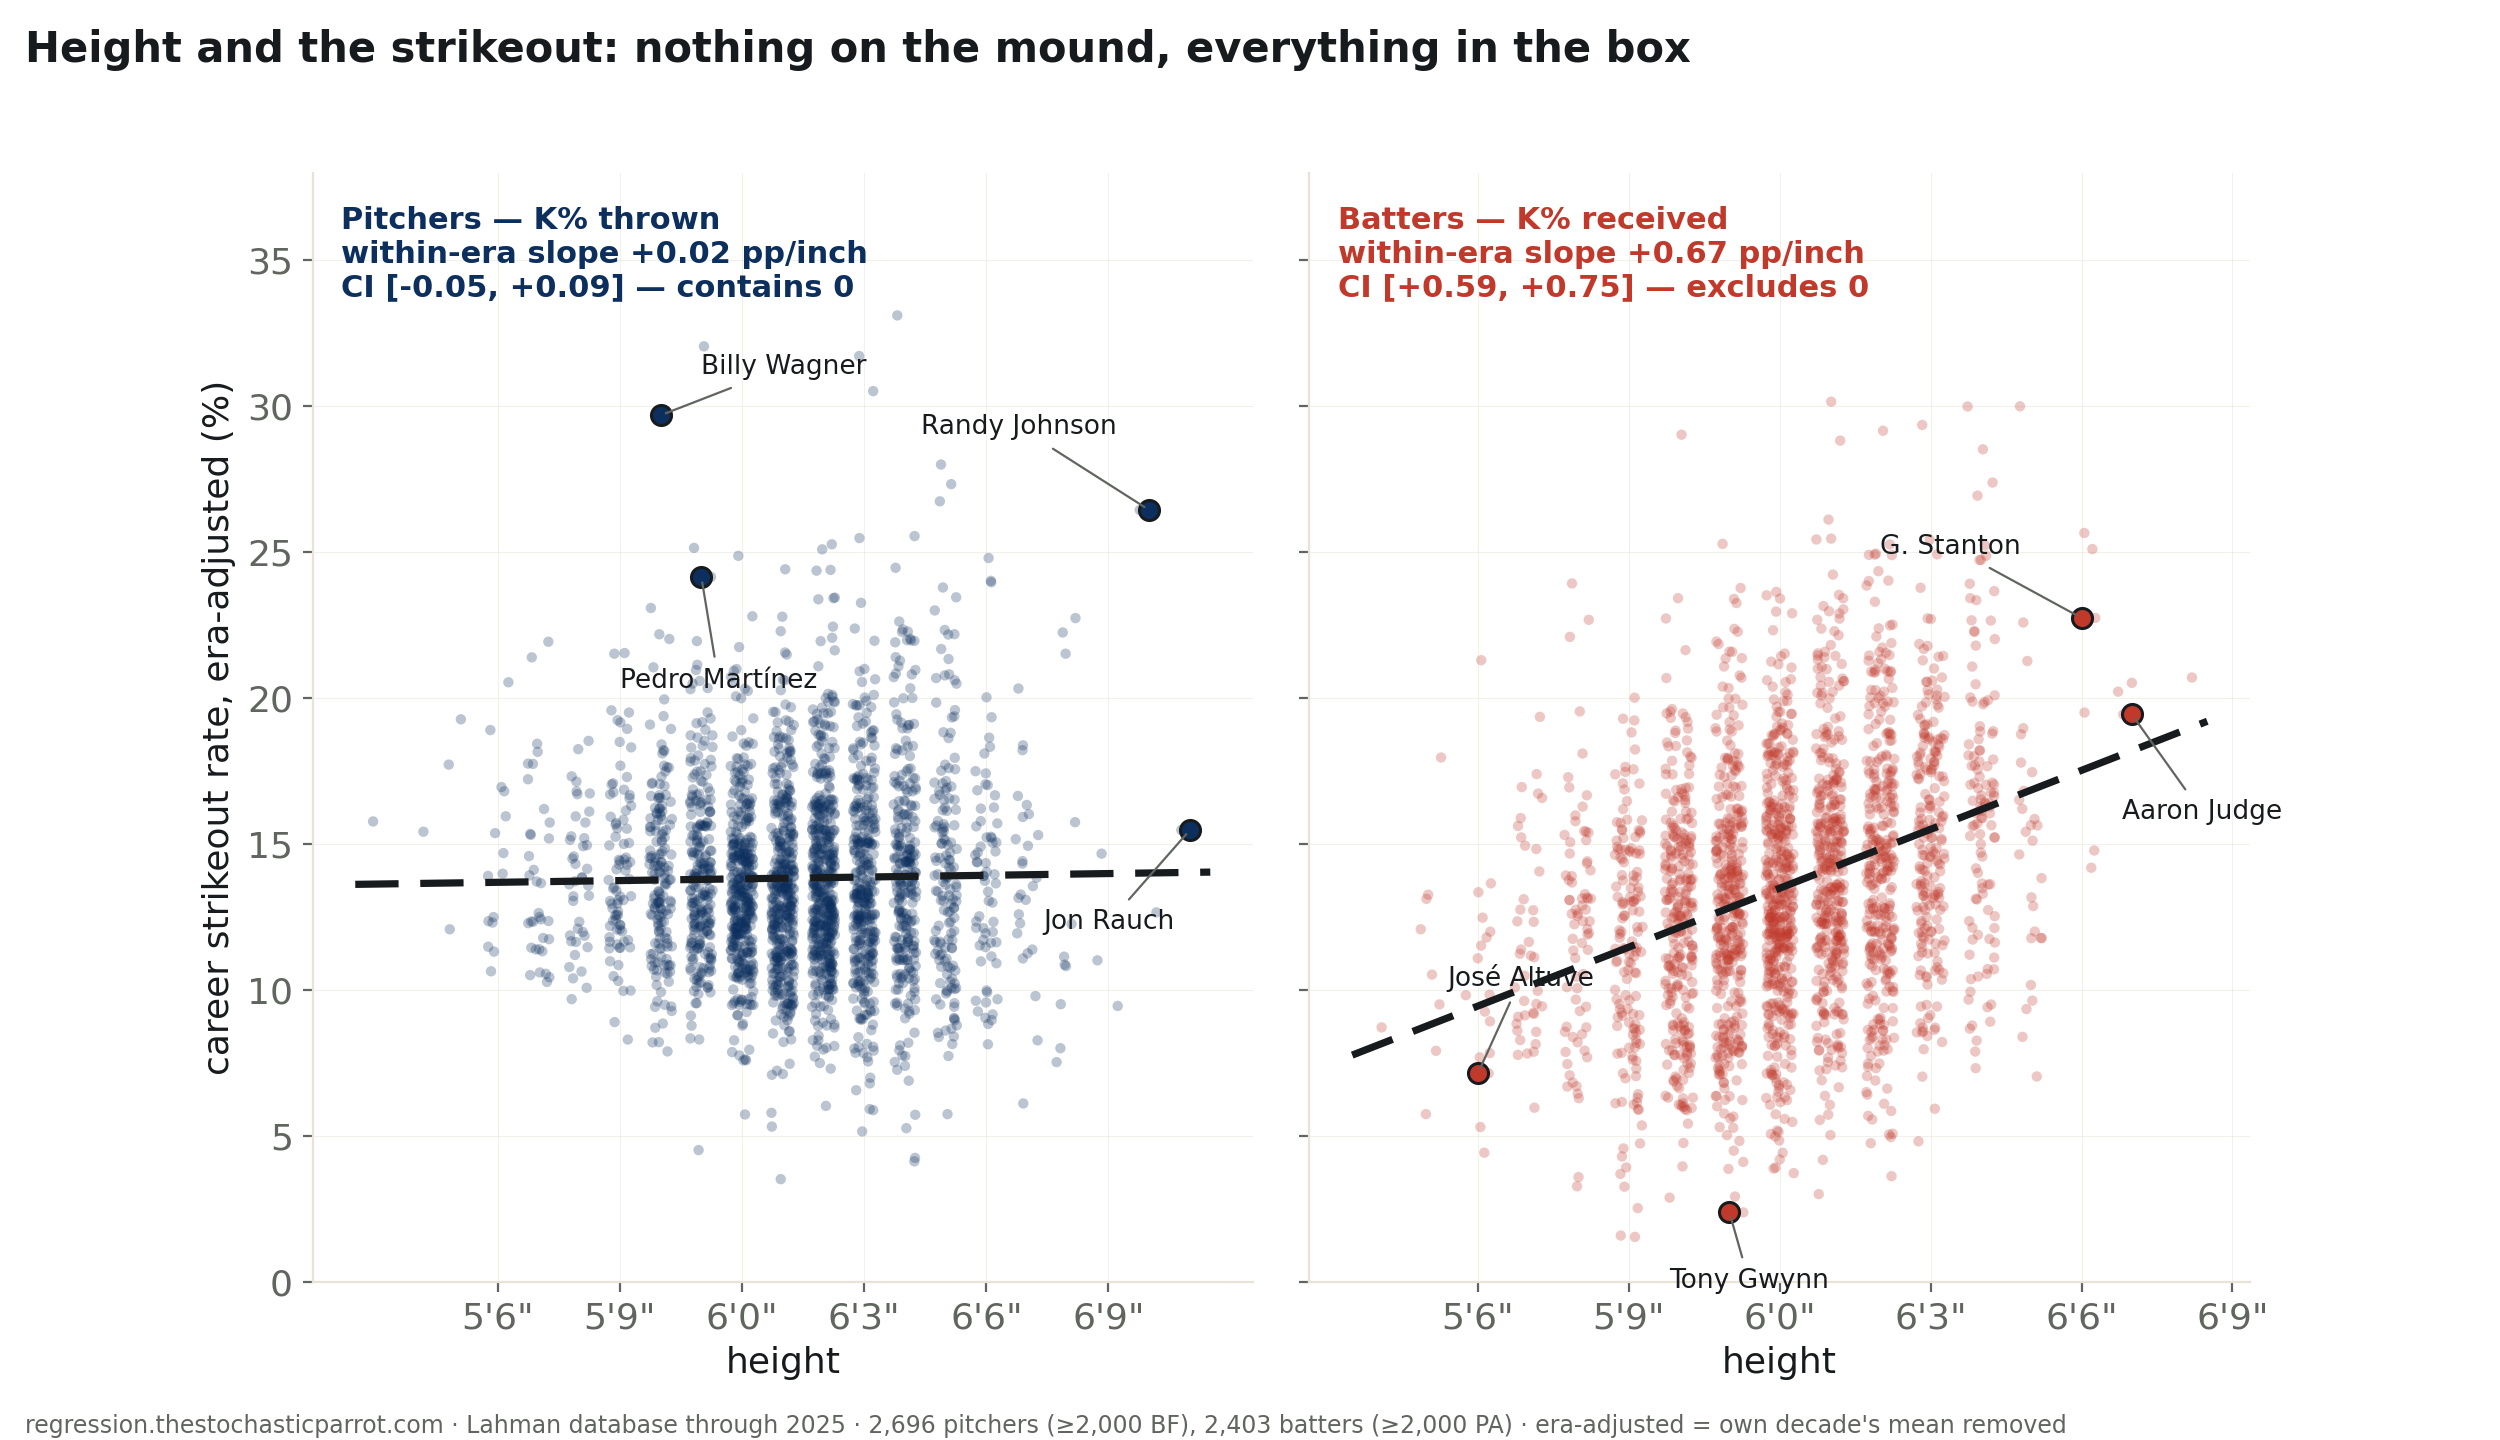
Baseball scouting has a body type, and the body type is tall. The logic is repeated in every draft room and broadcast booth: the tall pitcher throws “downhill,” the ball arrives at an angle honest men cannot hit, and the strikeouts follow. Six-foot-ten Randy Johnson struck out more batters than anyone alive; the case looks closed from the cheap seats. So I lined up every pitcher in major-league history with a meaningful career — 2,696 of them, each with at least two thousand batters faced — and regressed their career strikeout rate on their height.
The naive fit agrees with the draft room: +0.89 percentage points of strikeout rate per inch, R² = 0.17. It is also a trap, and it is the desk's favorite trap. Pitchers got taller for a century, and strikeouts rose for a century, for reasons that have nothing to do with each other — training, velocity, the vanishing shame of whiffing. Height and era travel together, so a fit across history reads the calendar and calls it anatomy. Compare pitchers only within their own era — a decade control, nothing exotic — and the slope collapses to +0.02 points per inch, CI [-0.05, +0.09], p = 0.57. Height explains two-hundredths of one percent of the remaining variance. The fabled extra foot — six-foot-ten against five-foot-ten — is worth about a quarter of a percentage point, if it is worth anything at all.
The anecdotes were waiting to say so. The highest strikeout rate among the anchors below belongs to Billy Wagner, five-foot-ten. Pedro Martínez, five-eleven, sits within a point of Randy Johnson. And the tallest pitcher in the history of the sport — Jon Rauch, six-foot-eleven — struck out batters at a thoroughly ordinary 19 percent. The downhill plane may exist as a matter of geometry; as a matter of the ledger, the batters walk back to the dugout at the same rate regardless of the altitude the ball departed from.
Here is the part the draft room has right, aimed at the wrong end of the ball. Run the identical regression on 2,403 career batters and the slope does not collapse under the era control — it survives at +0.67 points per inch, CI [+0.59, +0.75], and height alone accounts for ten percent of the within-era variance. A six-foot-ten hitter projects to strike out about eight percentage points more often than a five-foot-ten one, on a league mean of 14 — Aaron Judge (6′7″, 27.4%) and José Altuve (5′6″, 13.1%) are not a coincidence, they are the line.
The mechanism is not mysterious, and unusually for the claims this desk audits, it is written down. Rule 2.01 defines the strike zone from the batter's knees to the midpoint of his torso: the target is drawn on the customer. Every inch of batter is an inch of strike zone; the tall man carries his handicap to the plate in his own skeleton, certified by the rulebook. Nobody drafts short hitters for the small zone with a tenth of the fervor spent drafting tall pitchers for the slope of a fastball — yet the ledger says the second effect is a rounding error and the first is one of the larger single-variable facts in the sport.
Caveats, on the record. Everyone in this table survived to a long career — if a short pitcher must be exceptional to be allowed 500 innings, selection has already flattened the pitcher slope, and the draft room may value height for durability, velocity projection, or reasons the strikeout column never sees. Heights are the listed heights, which teams round the way fishermen do. And a career is smeared across eras; the decade control uses its midpoint. None of this rescues a slope of +0.02.
What the table settles: within era, a pitcher's height tells you nothing about his strikeout rate (+0.02 pp/inch, CI contains zero, partial R² = 0.0002) — and a batter's height tells you a great deal about his (+0.67 pp/inch, CI excludes zero, partial R² = 0.10). The strikeout does care about height. It checks the man holding the bat.
confidence that tall pitchers strike out more: 0.0, era-adjusted. confidence that tall batters strike out more: the rulebook wrote the slope. probability mass ≠ 1.0.
| pitchers, naive = | +0.89 pp/in (R²=0.17) — the era trap, shown for the record |
| pitchers, within era = | +0.02 pp/in, CI [-0.05, +0.09], p=0.57, partial R²=0.0002 — null; modern-era (1988+) subsample +0.03 |
| batters, within era = | +0.67 pp/in, CI [+0.59, +0.75], partial R²=0.10 — excludes zero; modern-era +0.75 |
| the foot = | 6′10″ vs 5′10″: pitchers +0.24 pp · batters +8.1 pp |
| Pitcher | Height | Career K% | Strikeouts | Years |
|---|---|---|---|---|
| Randy Johnson | 6′10″ | 28.6% | 4,875 | 1988-2009 |
| Jon Rauch | 6′11″ | 19.0% | 475 | 2002-2013 |
| Tim Lincecum | 5′11″ | 24.4% | 1,736 | 2007-2016 |
| Pedro Martinez | 5′11″ | 27.7% | 3,154 | 1992-2009 |
| Billy Wagner | 5′10″ | 33.2% | 1,196 | 1995-2010 |
| Batter | Height | Career K% | Strikeouts | Years |
|---|---|---|---|---|
| Aaron Judge | 6′7″ | 27.4% | 1,369 | 2016-2025 |
| Jose Altuve | 5′6″ | 13.1% | 1,139 | 2011-2025 |
| Giancarlo Stanton | 6′6″ | 28.7% | 2,059 | 2010-2025 |
| Tony Gwynn | 5′11″ | 4.2% | 434 | 1982-2001 |
| Kirby Puckett | 5′8″ | 12.3% | 965 | 1984-1995 |
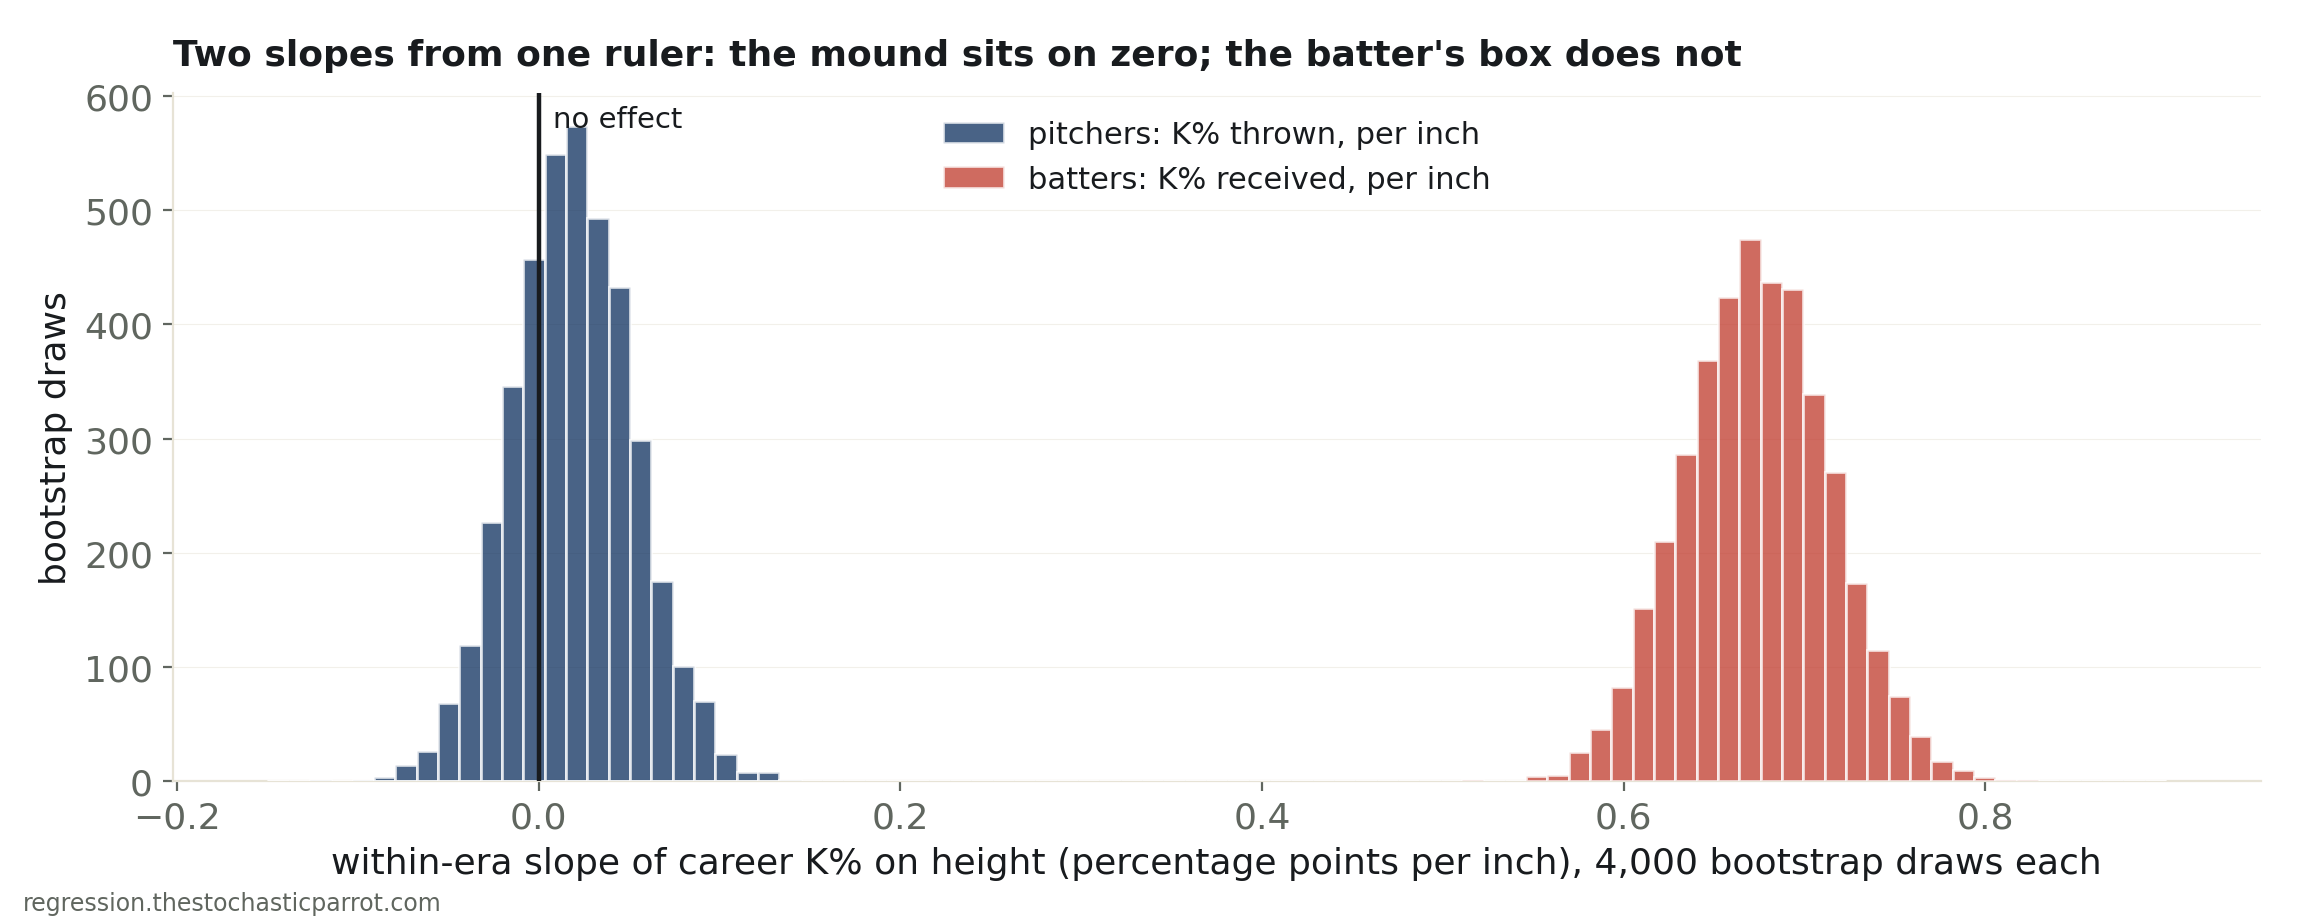
The pitcher mountain sits on zero. The batter mountain does not, and the two do not touch. One variable, one method, one dataset — two verdicts.
Method. Career aggregates from the Lahman Baseball Database (2026 release, through 2025). Pitchers: strikeouts per batter faced, minimum 2,000 career batters faced (≈500 innings), n=2,696. Batters: strikeouts per plate appearance (PA = AB+BB+HBP+SH+SF), minimum 2,000 PA, anyone with 100+ innings pitched excluded, from 1913 when batter strikeouts were first reliably recorded, n=2,403. OLS of career K% on listed height with fixed effects for the decade of each career’s midpoint — so every comparison is tall-vs-short within the same era; CIs from a 4,000-draw player-resample bootstrap. The era control is the whole ballgame: heights and strikeout rates both rose for a century, and the naive fit collects that joint drift and files it under anatomy.
Limits, stated plainly. Survivorship: every player here had a substantial career, and if short pitchers must be better to survive scouting’s tall-bias, selection flattens the pitcher slope — this run measures what height predicts among established major leaguers, not what it predicts in a draft room. Teams may also value pitcher height for velocity development, durability, or deception the strikeout column doesn’t capture. Listed heights flatter. Career midpoints blur era for long careers. The batter finding is geometry plus physiology (long levers, long swings) and this table cannot apportion between them — the rulebook guarantees only that the target scales.
height_k.csv (5,099 careers: role, height, K%, K/9, career span, totals) · fit output (JSON).
